
Figure 4.
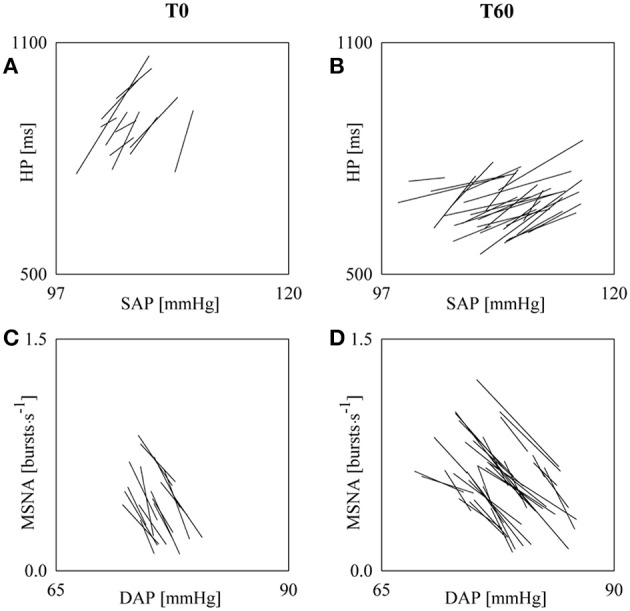
The line plots show the linearly-interpolated spontaneous cBR (A,B) and sBR (C,D) sequences derived in a subject from SAP and HP series and from DAP and MSNA series respectively during T0 (A,C) and T60 (B,D). The analyses were carried out over SAP, HP, DAP, and MSNA series of 256 values. The larger number of cBR and sBR sequences, leading to larger SEQ%cBR and SEQ%sBR, and the flatter slopes, leading to cBRSSEQ and sBRSSEQ closer to zero, are evident during T60 compared to T0.