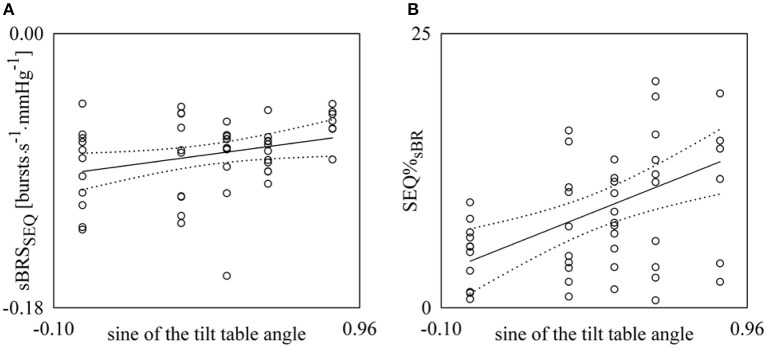
Figure 6.
Linear regression analyses of sBRSSEQ (A) and SEQ%sBR (B) on the sine of the tilt table angles during incremental orthostatic challenge. Individual values (open circles) of sBRSSEQ and SEQ%sBR are shown as a function of the sine of the tilt table inclination. The linear regression (solid line) and its 95% confidence interval (dotted lines) are plotted as well if the slope of the regression line is significantly larger than zero with p < 0.05.

