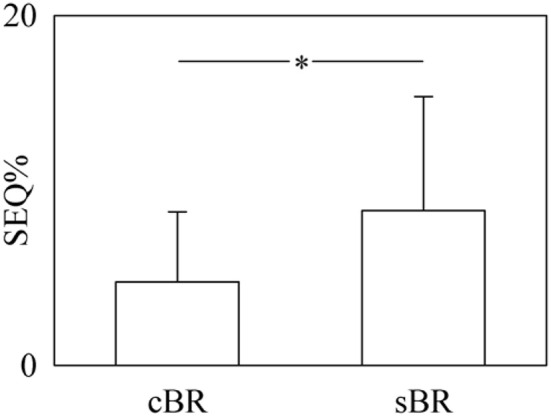
Figure 7.

The bar graph shows the percentage of sequences (SEQ%) as a function of the arm of the baroreflex (i.e., cBR and sBR). SEQ% values were pooled together regardless of the experimental condition. Values are given as mean plus standard deviation. The symbol * denotes a p < 0.05.
