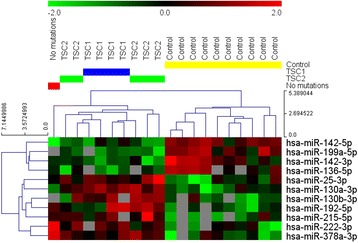
Fig. 1.

Expression scores of the 11 miRNAs that showed significant differences between the TSC and control groups. Higher dCq values represent higher expression as described in the Materials and Methods section. Expression values were normalized with one unit of the heatmap color range corresponding to one standard deviation of miRNA expression across the whole compared group. Gray panels represent lack of expression of a given miRNA in a specific sample
