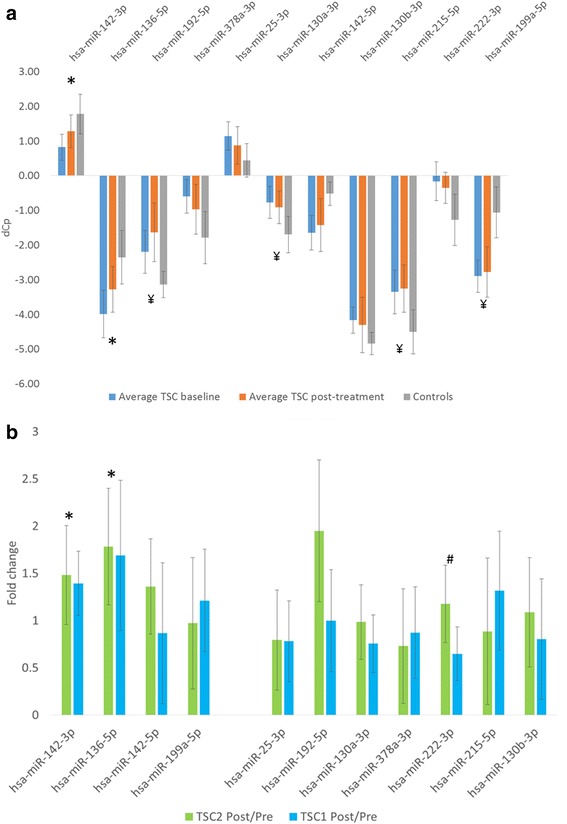
Fig. 2.

MiRNA expression level changes before and after treatment with Everolimus. a – average levels of specific miRNAs before and after treatment with everolimus and controls. In case of miR-136 and miR-142-3p, a significant increase in expression was observed after the introduction of therapy, making post-treatment expression levels closer to those observed in the control group. * - significant difference between pre- and post-everolimus expression levels and a lack of significant difference between post-everolimus and control levels, ¥ - significant difference between post-everolimus and control expression levels with non-significant change in paired pre- vs post-treatment expression levels. b – Interaction analysis of the impact of treatment with everolimus on miRNA expression levels. In case of mi-136 and miR-142-3p, significant increases were treatment-dependent but did not differ between the patients with TSC1 or TSC2. In case of miR222, a decrease (in this case, a change towards values observed in the control group) was observed only in patients with TSC1. * - significant for the pre/post treatment effect and non-significant for the treatment/TSC type interaction, # - significant for the treatment/TSC interaction and non-significant for the pre/post treatment effect in the whole group
