
Fig. 1.
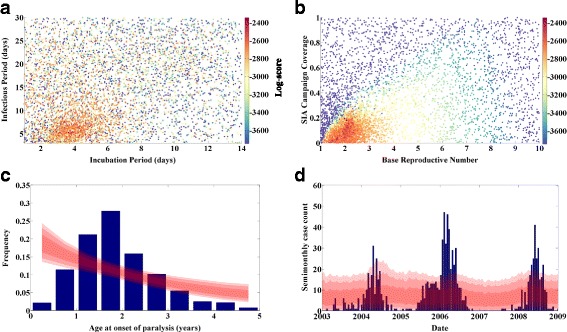
Calibration of basic SEIR model. a Log-score (color) vs. incubation and infectious period. b Log-score vs. R0 and campaign coverage. c Data (blue) and score-weighted distribution of simulations (68, 95, 99 % quantiles in red) for age distribution of paralysis cases. d Data (blue) and score-weighted distribution of simulations (68, 95, 99 % quantiles in red) for time series of case counts