
Fig. 2.
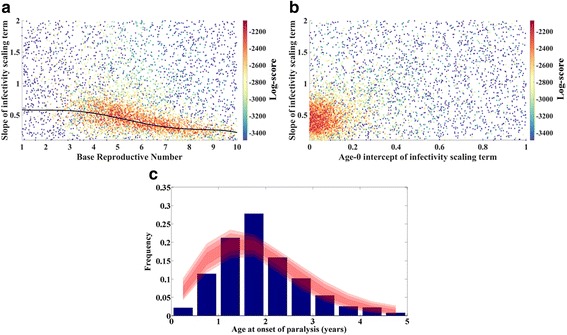
Calibration of SEIR model w age-dependent transmission. a Log-score (color) vs. base infectivity and the slope of age-dependent susceptibility in early life (described in text). b Log-score (color) vs. the age-0 intercept and slope of age-dependent susceptibility in early life. c Data (blue) and score-weighted distribution of simulations (68, 95, 99 % quantiles in red) for age distribution of paralysis cases