
Fig. 5.
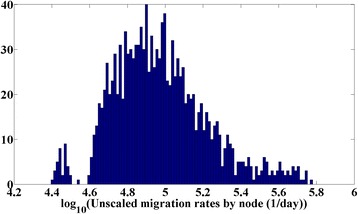
Histogram of unscaled outbound migration rates by node. The high-score region shown in Fig. 4 centers around a scaling factor of -6, indicating expected migration rates for most nodes at ~0.1 per person per day
Official websites use .gov
A
.gov website belongs to an official
government organization in the United States.
Secure .gov websites use HTTPS
A lock (
) or https:// means you've safely
connected to the .gov website. Share sensitive
information only on official, secure websites.
Histogram of unscaled outbound migration rates by node. The high-score region shown in Fig. 4 centers around a scaling factor of -6, indicating expected migration rates for most nodes at ~0.1 per person per day