Figure 3.

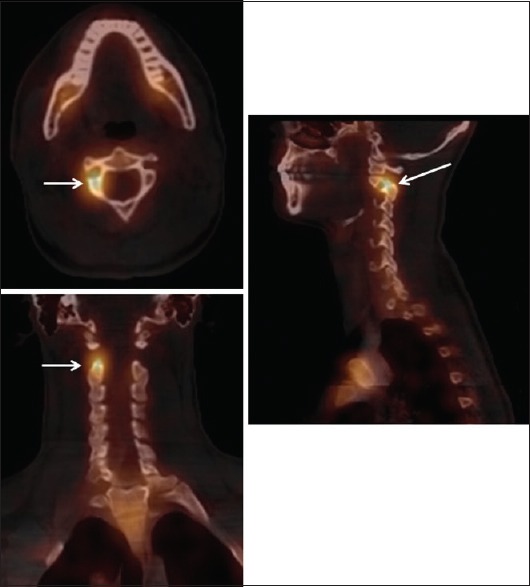
Axial, coronal, and sagittal 99mTc-methylene diphosphonate single-photon emission computed tomography/computed tomography fusion images demonstrate focal increased activity (arrows) within the right C2 lamina

Axial, coronal, and sagittal 99mTc-methylene diphosphonate single-photon emission computed tomography/computed tomography fusion images demonstrate focal increased activity (arrows) within the right C2 lamina