
Fig. 3.
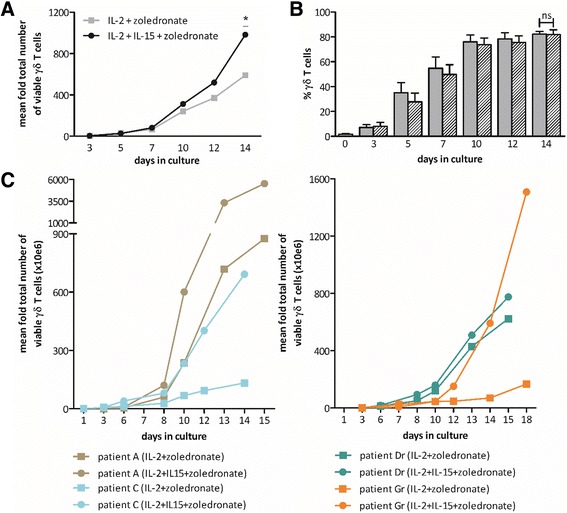
Kinetics of γδ T cell expansion. a The graph represents the average (n = 6, healthy donors) mean fold total number of γδ T cells, calculated as the absolute number of γδ T cells at the respective time point divided by the absolute number of γδ T cells at start of the expansion culture. b Bar graphs showing the proportion of γδ T cells at various times during the culture, starting from day 0. Cultures expanded with zoledronate and IL-2 are displayed as gray bars, and cultures supplemented with zoledronate, IL-2, and IL-15 are shown as hatched bars. Data are expressed as mean percentages of 6 healthy donors from three experiments. c The increase in number of “successfully” cultured γδ T cells from different AML patients is presented as mean fold total number of viable γδ T cells. Patients in remission are indicated by a lowercase r after their letter of identification (right panel). Wilcoxon matched-pairs signed rank test. P patient; *p < 0.05; ns not significant