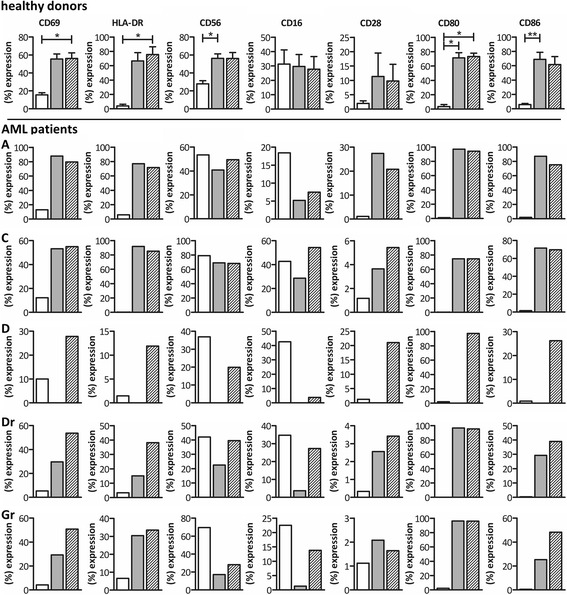
Fig. 5.

γδ T cell phenotype prior and subsequent to expansion. Comparison of the expression of CD69, HLA-DR, CD56, CD16, CD28, CD80, and CD86 on unstimulated (white bars), IL-2+zoledronate expanded (gray bars) and IL2+IL-15+zoledronate expanded (hatched bars) γδ T cells. Results are shown for six healthy donors on the uppermost row as mean percentage. Expression levels of the respective markers of patient γδ T cells are showed below. Due to the low number of γδ T cells after expansion with IL-2 + zoledronaat of patient D, no data are available. Friedman test with Dunn’s multiple comparison test. **p < 0.01; *p < 0.05
