Figure 1.
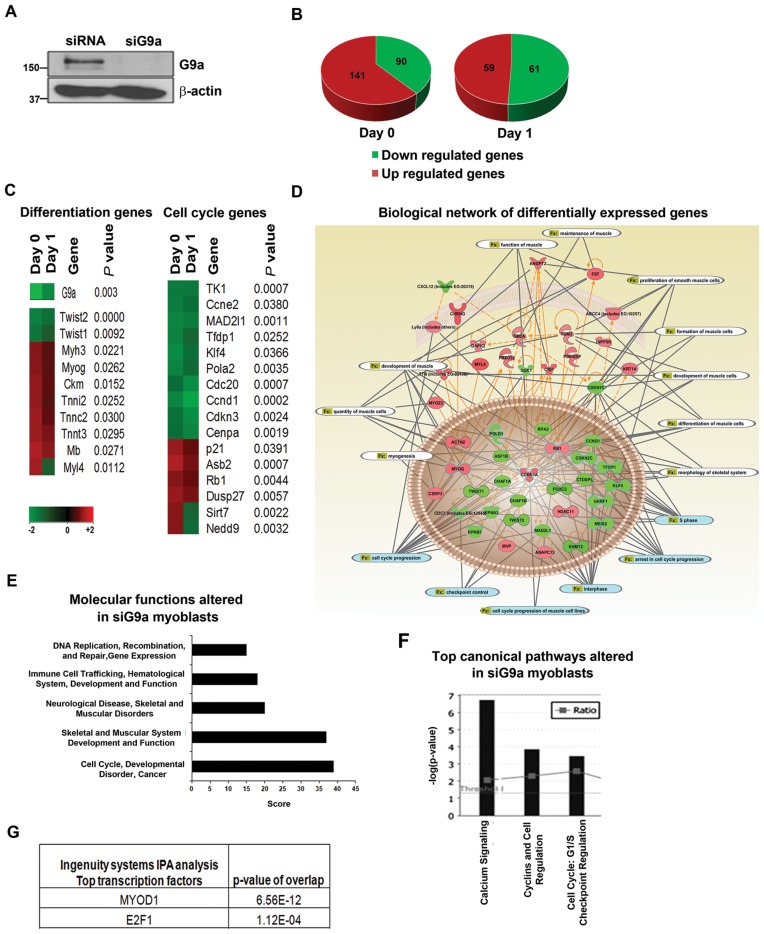
Global gene expression analysis in G9a knockdown C2C12 myoblasts. (A) C2C12 cells were transfected with scrambled siRNA (siRNA) or G9a specific siRNA (siG9a) for 48 hr. G9a expression was analysed in siRNA and siG9a cells by western blot. β-actin was used as loading control. (B) Microarray analysis was done with two biological replicates of siRNA and siG9a cells in proliferating (Day 0) and differentiating conditions (Day 1). Pie charts show the total number of genes whose expression is significantly upregulated and downregulated in Day 0 and Day 1 siG9a cells compared to control siRNA cells. Differential gene expression was determined by comparing the mean of siG9a biological replicates to control replicates. Green indicates downregulation and red indicates upregulation of gene expression. (C) Heatmap was generated with a partial list of G9a target genes involved in differentiation and cell cycle control in Day 0 and Day 1 cells with corresponding P-values and fold changes according to the colour scale at the bottom. Gene expression clustering was performed by the associate program Gene Cluster and viewed in TreeView software (D) Differentially expressed genes were used to create biological networks. Orange lines indicate direct regulation between genes whereas dotted lines indicate indirect regulation. Grey lines indicate functions (Fx) altered by the genes which are related to cell cycle progression (blue) and muscle differentiation (white). (E) Top molecular functions altered in siG9a myoblasts include cell cycle regulation, skeletal muscle development and function and muscle disorders. (F) Top canonical pathways altered upon G9a knockdown including Cyclins and cell cycle regulation. (G) IPA analysis revealed that the activity of the transcription factors MyoD and E2F1 is significantly altered in siG9a cells.

