Figure 2.
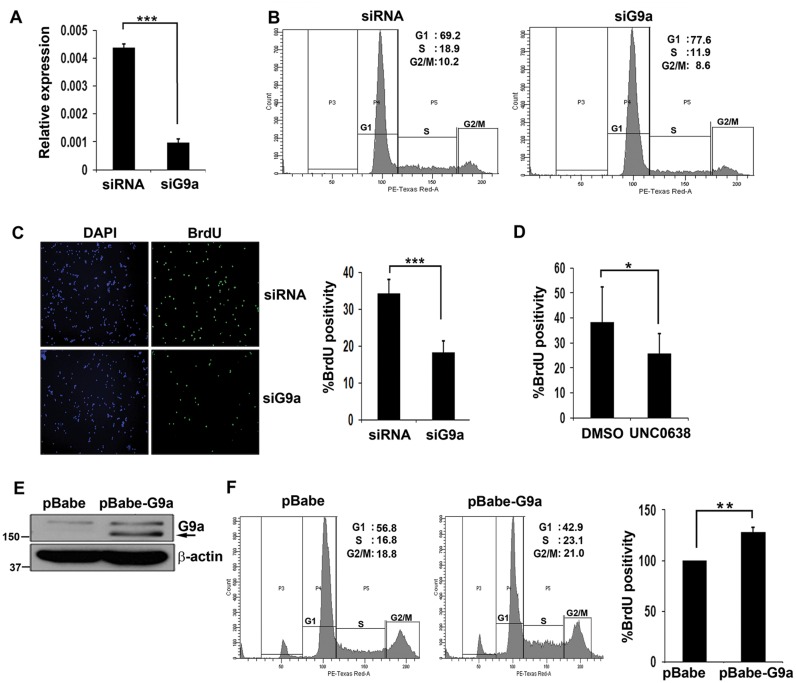
G9a promotes myoblast proliferation. (A) Primary myoblasts were transfected with scrambled siRNA (siRNA) or G9a siRNA for 48 hr in growth medium. G9a expression in control (siRNA) and siG9a cells was analysed by qRT-PCR. (B) Control and siG9a primary myoblasts cultured in growth medium were stained with PI and analysed by flow cytometry. siG9a primary myoblasts had less S phase cells compared to control cells. At least 10 000 cells were counted. (C) BrdU incorporation was analysed in proliferating control and siG9a primary myoblasts. Nuclei were counter stained with DAPI. To quantify the percentage of BrdU+ cells, at least 500 cells were counted. (D) Primary myoblasts were treated with UNC0638 or DMSO as a vehicle control for 36 hr in growth medium. For each experiment, at least 500 nuclei in 5–6 random fields were counted and the percentage of BrdU+ cells was quantified. The results are representative of two independent experiments. Error bars indicate the mean of BrdU+ cells in each experiment ± SD. (E) pBabe and pBabe-G9a expressing C2C12 cells were analysed for G9a expression by western blot. β-actin was used as loading control. Arrow indicates G9a overexpression. Numbers indicate the molecular weight of proteins. (F) Equivalent number of pBabe and pBabe-G9a C2C12 cells were stained with PI and at least 10 000 gated population were analysed. Flow cytometric analysis showed higher S phase cells upon G9a overexpression. All results are representative of at least three independent experiments. pBabe and pBabe-G9a cells were pulsed with BrdU and the percentage of BrdU+ cells was quantified. At least 500 cells were counted in each experiment from 5–6 random fields. Error bars indicate the mean of BrdU+ cells in three independent experiments ± SEM (n = 3).

