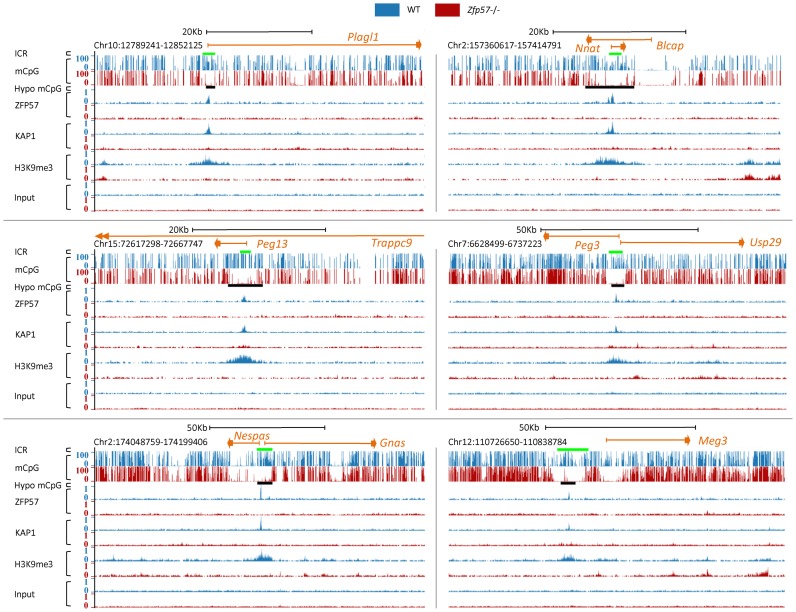
Figure 1.
Extensive loss of mCpG and H3K9me3 at ICRs in Zfp57 −/− A3 ESCs. Screen shots from the UCSC Genome Browser of examples of mCpG and H3K9me3 profiles together with ZFP57 and KAP1 binding profiles at ICRs in WT (in blue) and Zfp57 −/− (in red) A3 ESCs, as determined by WGBS-seq and ChIP-seq. ICRs are indicated by green bars, and hypomethylated regions (hypo mCpG) in Zfp57 −/− A3 ESCs that overlap with ZFP57 peaks by black bars. Genes are indicated by orange lines at the top of each panels. Note that in all cases ZFP57 and KAP1 bind within the ICR sequences that are characterised by ZFP57-dependent mCpG and H3K9me3.

