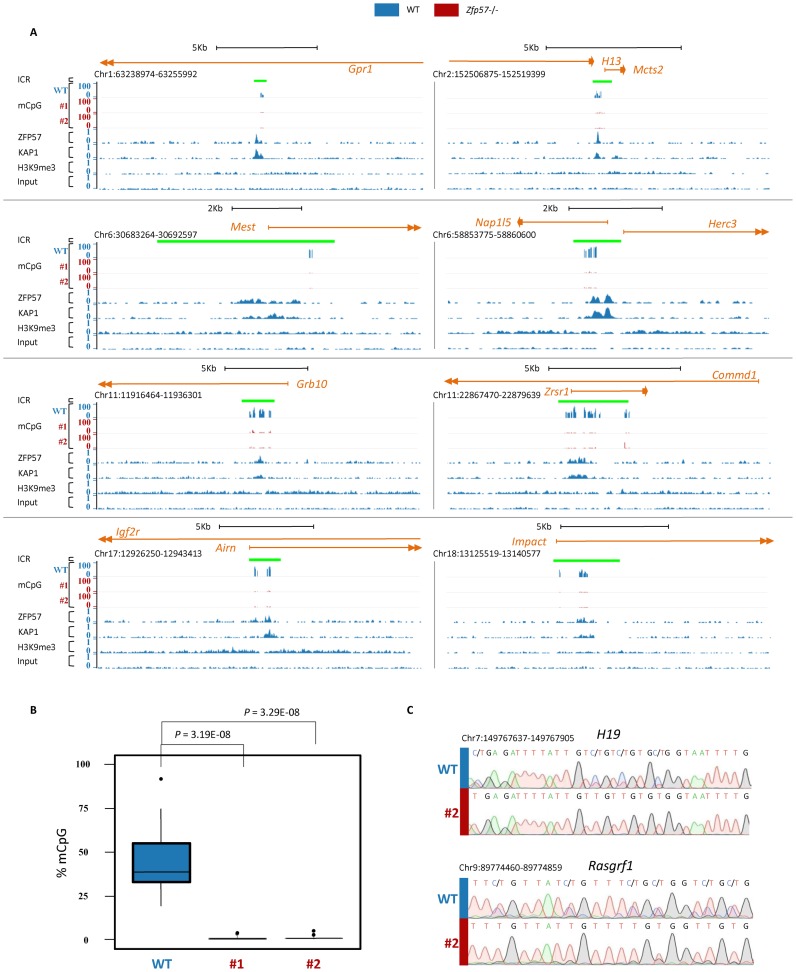
Figure 2.
ZFP57 binding maintains mCpG at all ICRs in mouse E14 ESCs. A) Screen shots from the UCSC Genome Browser showing the mCpG profiles at ICRs determined by RRBS in WT (in blue) and two Zfp57 -/- (#1 and #2, in red) E14 ESC lines, together with ZFP57 and KAP1 binding and H3K9me3 profiles determined by ChIP-seq in WT E14 ESCs (in blue). The ICRs are indicated as green bars. (B) Box plot showing the distribution of mCpG levels at 18 ICRs determined by RRBS in WT (in blue) and Zfp57 −/− (line 1 and line 2, in red; see also Supplementary Table S6) E14 ESC lines. In the box-plot, upper and lower hinges correspond to the first and third quartiles, the upper whisker extends from the hinge to the highest value that is within 1.5 × IQR of the hinge, where IQR is the inter-quartile range, or distance between the first and third quartiles, the lower whisker extends from the hinge to the lowest value within 1.5 × IQR of the hinge. Data beyond the end of the whiskers are outliers and plotted as points. The difference between the methylation level of 18 ICRs in WT and two Zfp57 −/− E14 ESC lines is statistically significant (P < 0.001 calculated with two-tailed Student's t-test assuming unequal variances). (C) DNA methylation analysis of H19 and Rasgrf1 ICRs determined by direct bisulfite sequencing in WT (indicated by vertical blue bar) and Zfp57 −/− line 1 E14 (red bar) ESCs. Comparable results have been obtained in the Zfp57 −/− E14 ESC line 2. Note ZFP57 binding and mCpG maintenance in WT and complete mCpG loss in Zfp57 −/− E14 ESCs at all ICRs.

