Figure 3.
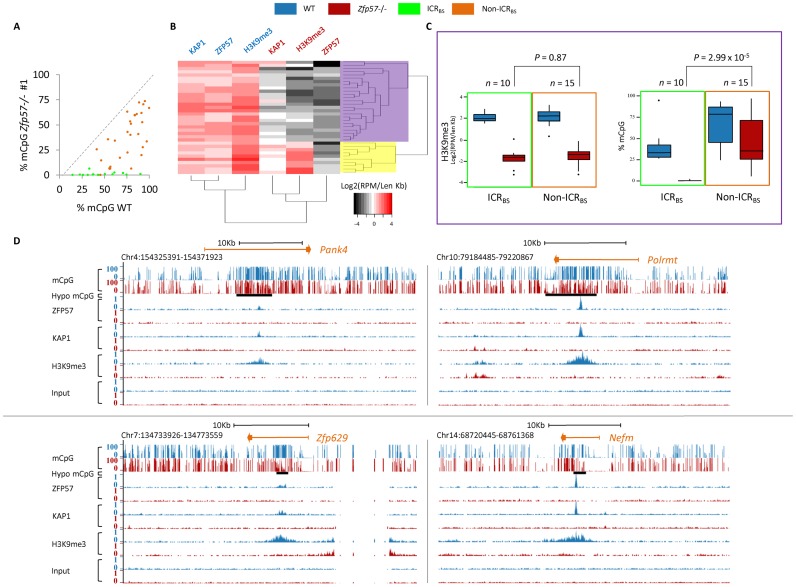
ZFP57 controls repressive epigenetic modifications at ICRBS and non-ICRBS. (A) Scatter plot showing mCpG levels under ZFP57 peaks in WT and Zfp57 -/- E14 ESC line 1, as determined by RRBS. ICRBS are in green and non-ICRBS in orange. Comparable results were obtained in Zfp57 −/− E14 ESC line 2 (see Supplementary Table S7). (B) Hierarchical clustering of ZFP57, KAP1 and H3K9me3 ChIP-seq peak intensities in WT (indicated in blue) and Zfp57 −/− (indicated in red) A3 ESCs. A larger cluster of ZFP57 binding sites (shaded in purple) loses H3K9me3 and KAP1, while a minor cluster (shaded in yellow) shows similar or slightly reduced levels in Zfp57 −/− A3 ESCs. (C) Box plots showing distributions of H3K9me3 peak intensities and mCpG levels of the ZFP57 binding sites highlighted in purple in (B) divided in ICRBS (included in green frame) and non-ICRBS (included in orange frame), in WT (blue) and Zfp57 −/− (red) A3 ESCs. The distributions of H3K9me3 of ICRBS and non-ICRBS in Zfp57 −/− ESCs do not differ (P > 0.05 calculated with two-tailed Student's t-test assuming unequal variances) while those of methylation levels differ significantly (P < 0.001). (D) Screen shots from the UCSC Genome Browser describing examples of mCpG and H3K9me3 profiles together with ZFP57 and KAP1 binding profiles at non-ICRBS in WT and Zfp57 −/− A3 ESCs, reported as in Figure 1. Note that loss of ZFP57 and KAP1 binding leads to extensive loss of H3K9me3 with little effect on mCpG at non-ICRBS.

