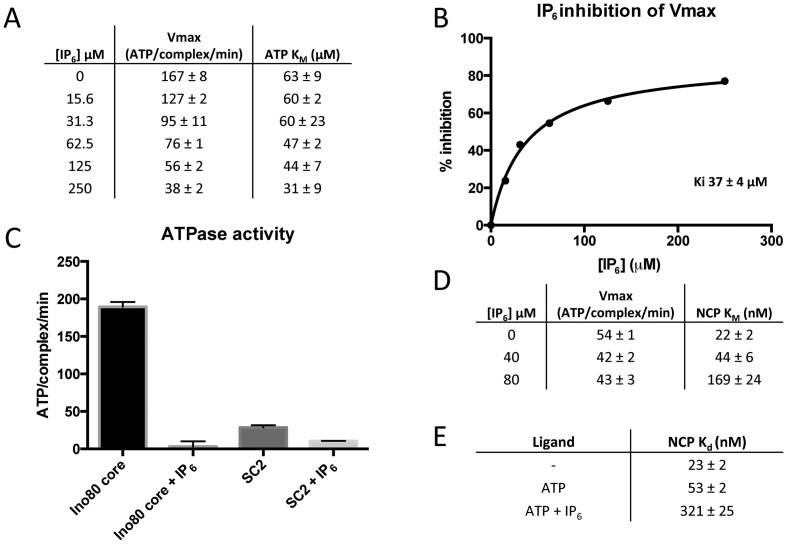
Figure 3.
IP6 inhibition mechanism. (A) ATPase activity of Ino80 over a range of IP6 and ATP concentrations. Nucleosome concentration was kept constant at 100 nM for all of these assays. (B) Vmax values from (A) plotted as % inhibition versus IP6 concentration, with 0% inhibition equal to where [IP6] is 0 μM. (C) Single point inhibition of Ino80 and SC2. Assays were conducted using 250 μM IP6, 1 mM ATP and 100 nM nucleosome. (D) ATPase activity of Ino80 over a range of nucleosome and IP6 concentrations. The ATP concentration was 1 mM for these assays. (E) MST binding data of Ino80 binding nucleosome in the presence and absence of different ligands. The ATP concentration was 1 mM and the IP6 concentration was 250 μM. These binding experiments were conducted in the presence of 5 mM MgCl2.

