Figure 1.
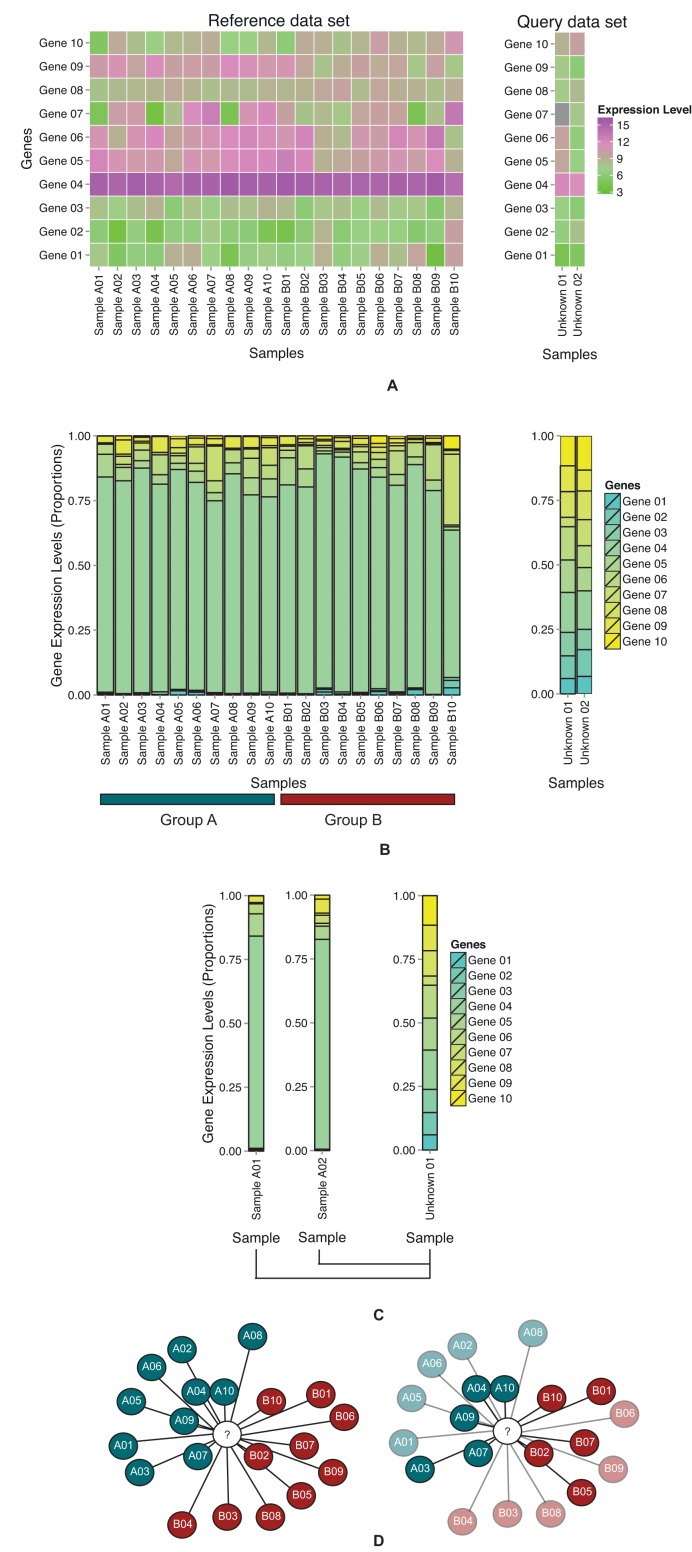
Schema of gene expression compositional assignment (A) Heatmaps of hypothetical query and reference data sets using normalised, log-transformed gene expression levels. The query samples are to be assigned reference group labels. (B) Bar charts of gene expression compositional ratios in query and reference samples. Gene expression levels are inverse-log-transformed and converted to gene expression compositional ratio format (values summing to 1). (C) A query sample is compared to each reference sample using GECA. (D) In the network, shaded nodes represent reference samples, coloured according to group labels. The white node represents a query sample. The relative position of reference nodes corresponds inversely to the GECA score against query samples. The query sample is assigned the reference group label with the lowest relative measure score (or mean score). Bootstrapping or random assignment tests the robustness of observed assignments. Non-significant assignments are faded, significant assignments are opaque.

