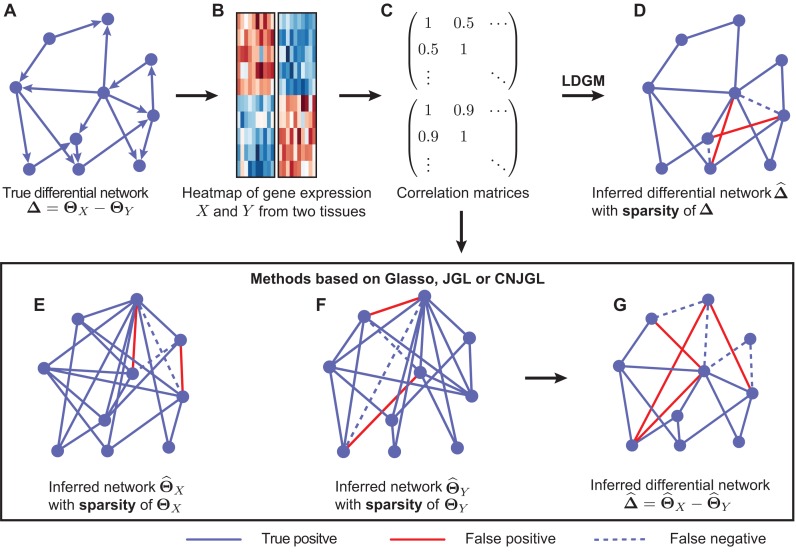
Figure 1.
Illustration of Latent Differential Graphical Model (LDGM) as compared to other graphical model based methods. (A) A toy example of a differential network between two tissues. (B) Gene expression levels of genes X and Y involved in the differential network in two tissues. (C) Sample correlation matrices of gene expression levels in the two tissues. (D) LDGM directly infers the differential network from the two correlation matrices. In contrast, other graphical model based methods (Glasso, JGL or CNJGL) first infer individual gene regulatory networks of tissues (E) X and (F) Y from correlation matrices separately, then infer the differential network by the difference between the (G) two reconstructed networks. Red solid lines represent false positive interactions while blue dashed lines represent false negative interactions in the reconstructed networks.

