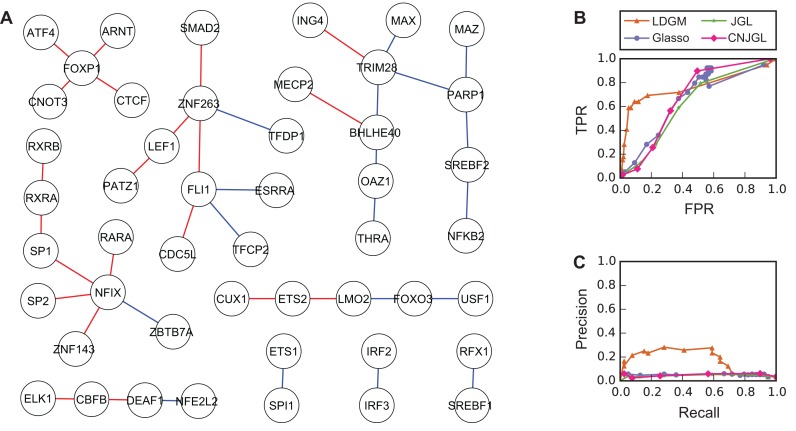
Figure 4.
Performance of different methods on the GTEx data (brain and whole blood data). (A) The benchmark network with 48 TFs and 39 tissue-specific interactions. Red edges are interactions specific to brain while blue edges are specific to whole blood. (B) ROC curves and (C) Precision-recall curves of different models to recover the benchmark network. Overall, LDGM outperforms the other models. LDGM, Glasso, JGL and CNJGL have AUC under ROC curves of 0.762, 0.593, 0.617, 0.637 and AUC under precision-recall curves of 0.178, 0.044, 0.048, 0.049, respectively.

