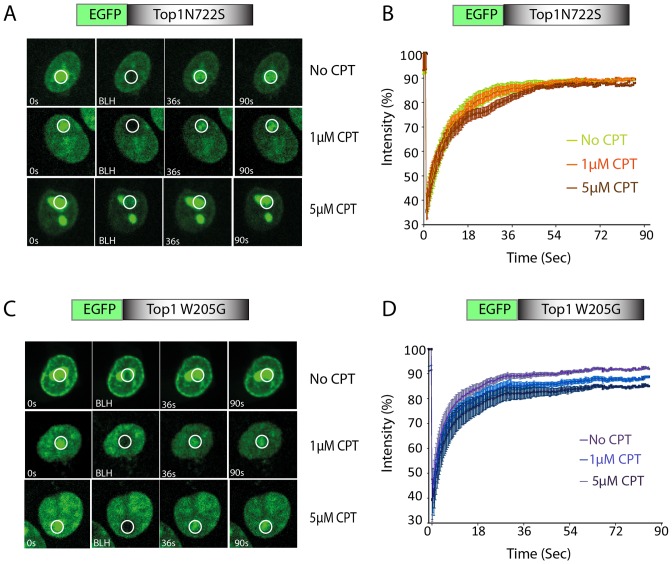
Figure 4.
Top1 W205 and N722 residues are critical for CPT-induced nuclear dynamics. Representative images showing the FRAP of Top1mutants (A) EGFP–Top1N722S or (C) EGFP–Top1W205G transiently expressed in HCT116 cells. Cells were treated with CPT (indicated CPT concentration) for 10 min and were analysed by live cell spinning disk confocal microscopy and photobleaching (FRAP analysis). A sub-nuclear spot (ROI) indicated by a circle was bleached (BLH) for 30 ms and photographed at regular intervals of 3 ms thereafter. Successive images taken for ∼90 s after bleaching illustrate fluorescence return into the bleached areas. Right panels (B and D) quantification of FRAP data showing mean curves of Top1 variants in the presence and absence of CPT. Error bars represent mean ± S.E. (n = 15).

