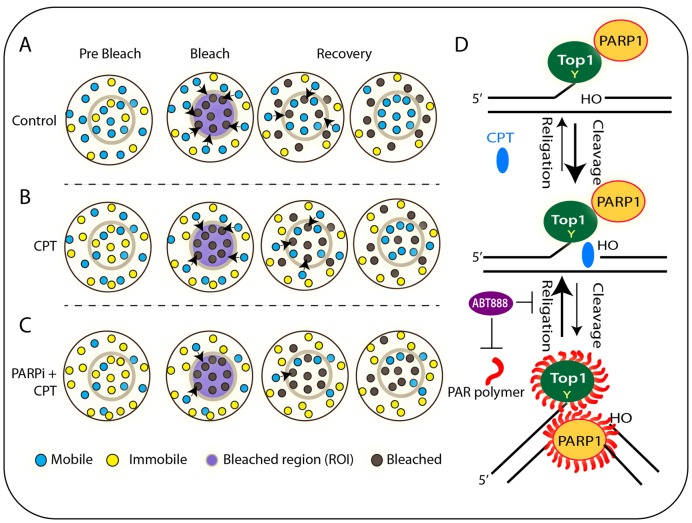
Figure 7.
Schematic representation of our findings regarding the Top1 dynamics in live cells and response to combination of PARP inhibitor (ABT-888) plus CPT as established by FRAP. (A) Cartoon representing a cell expressing fluorescent molecules (EGFP–Top1). The selected circular ROI of the cell is bleached by laser and imaged before and after photobleaching. The fluorescent intensity recovery of ROI by the surrounding molecule into the bleached area is monitored over time. Cells exhibit mainly two types of fluorescent molecule: mobile (unbound) and immobile (bound) (as indicated in the cartoon). After photobleaching cells exhibit bleached molecules. Exchanges occur between the mobile parts of two compartments. (B) Top1 poison (CPT) induces bound Top1cc formation. With increasing population of bound/immobile fraction, fluorescence exchange rate is reduced in FRAP recoveries. (C) PARP inhibitor (ABT-888) increased Top1 density in the nucleoplasm and enhanced the activity of CPT by trappingTop1cc (immobile fraction) across the genome. (D) Schematic representation of PARP1–Top1 coupling for regulation of Top1 catalytic activity. PARylation of Top1 helps in the religation of CPT-induced Top1 cleavage complex. ABT-888 prevents the Top1-PARylation and induces prolong trapping of CPT-induced Top1cc.

