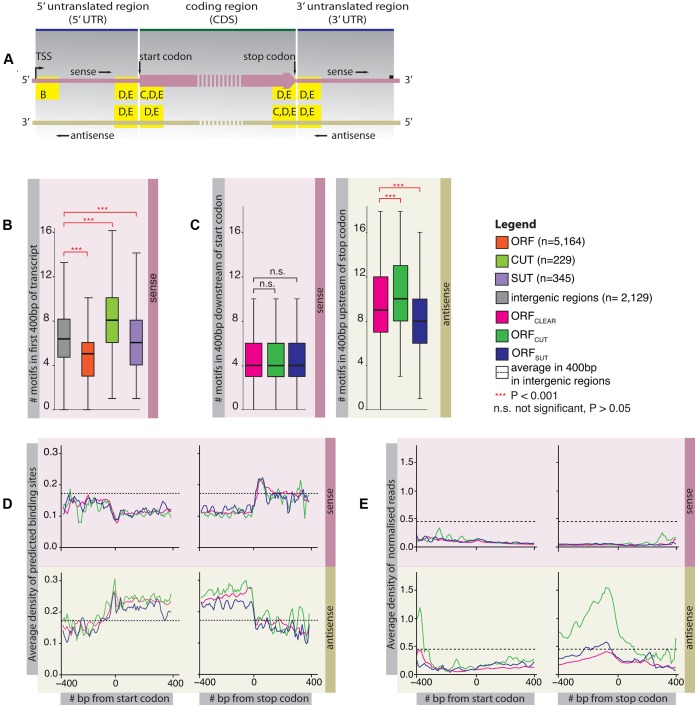
Figure 1.
Frequency of Nrd1 and Nab3 binding site sequences in different transcripts. (A) Schematic showing regions of interest inside ORF transcripts in the sense and antisense directions for panels B to E. (B) Boxplot showing the numbers of predicted binding sites 400 bp downstream of the transcription start site (TSS) in the sense direction of ORF transcripts, CUTs and SUTs. The number of predicted binding sites in 400 bp intergenic regions is shown as a control. The distributions of the numbers of predicted binding sites for different transcript types were compared using the two-sided Wilcoxon rank sum test. All comparisons between the transcript types and the control were statistically significant (alpha = 0.001) and are indicated in red. CUTs contain the most predicted binding sites, followed by SUTs and ORF transcripts. (C) Boxplot showing the numbers of predicted binding sites in ORF transcripts 400 bp downstream of the start codon in sense and 400 bp upstream of the stop codon in the antisense direction. ORFs are separated into those with no overlapping transcript (ORFCLEAR, n = 4229), those overlapping with a CUT in antisense (ORFCUT, n = 470) and a SUT in antisense (ORFSUT, n = 430). The distributions of the numbers of predicted sites for different transcript types were compared using the two-sided Wilcoxon rank sum test. All statistically significant comparisons are indicated in red (alpha = 0.001), the others in black. Occurrences of predicted binding sites are almost identical in the sense direction, but differ greatly in antisense depending on the overlapping transcript type. (D) Average densities of predicted binding sites in the sense and antisense directions ±400 bp of the start and stop codons of ORFs. Numbers of predicted sites were binned in 10 bp windows and normalised by the total number of transcripts that are long enough to contribute to the bin. As a control for each the 400 bp regions, we show the mean of the average densities of predicted sites in 400 bp in intergenic regions (n = 2129). Densities differ between ORF types only in the antisense direction inside coding regions, with ORFCUT (n = 470) displaying the highest densities, followed by ORFCLEAR (n = 4229) and ORFSUT (n = 430). (E) Average densities of PAR-CLIP reads ±400 bp of the start and stop codons of ORFCLEAR (n = 4198), ORFCUT (n = 468) and ORFSUT (n = 426) (excluded are ORFs whose sequences did not begin with a start codon and those that overlapped with each other by more than 10 bp). Reads were binned in 10 bp windows; the number of reads in each bin was normalised by the sense and antisense expression level of the transcript. We further normalised average expression-normalised PAR-CLIP occupancy in each bin by dividing by the total number of transcripts long enough to contribute to the bin. As a control for each of the 400 bp-long regions, we show the average of the binned average number of reads (normalised for expression) in 400 bp in intergenic regions (n = 2129). The differences in the occurrences of predicted binding sites are reflected in differences in protein binding.

