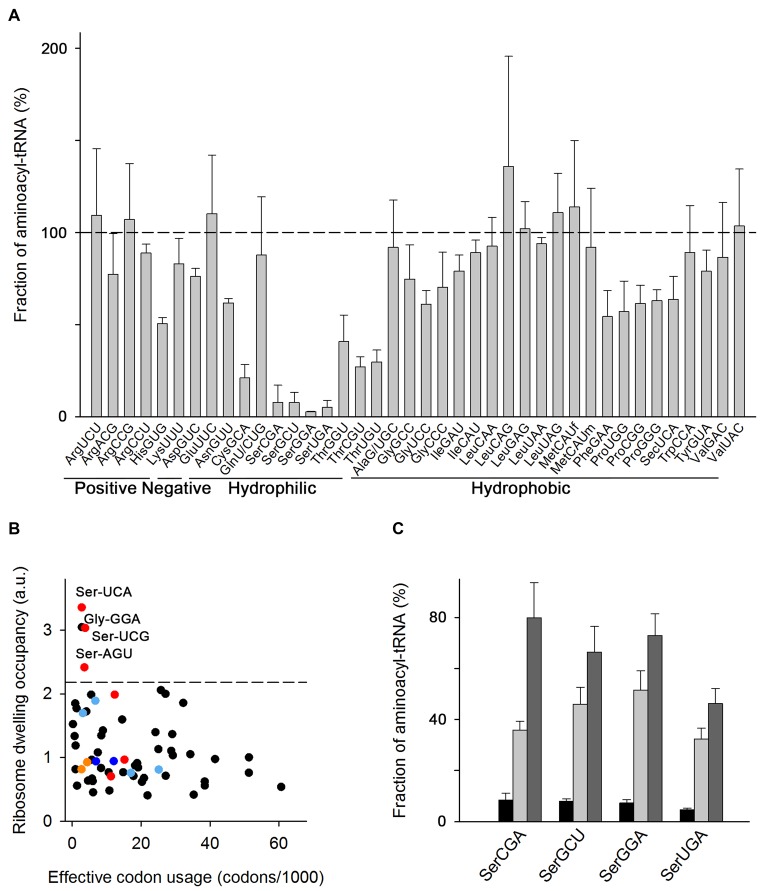
Figure 1.
Some tRNAs have suboptimal aminoacylation level in cells grown in LB medium. (A) Microarray of aminoacyl–tRNAs of E. coli MC4100 at OD600 = 0.5 grown in LB at 37°C. tRNA probes are shown with their anticodon and the corresponding amino acid and classified according to the properties of the amino acid. Data are means ± SEM of three biological replicates. The horizontal dashed line denotes the level at which all tRNAs are fully charged. MetCAUf and MetCAUm denote initiator and elongator tRNAs, respectively (see also Supplementary Table S1). (B) Average ribosome dwelling occupancy, i.e. the frequency of each codon in the ribosomal A site, as determined by ribosome profiling and plotted in correspondence to their frequency in the translatome (i.e. effective codon usage calculated from all mRNAs expressed in MC4100 cells using RNA-Seq). The codons with low levels of aminoacyl–tRNAs (from panel A) are color-coded: Ser codons in red, Cys codons in orange, His codons in blue and Thr codons in light blue. The dashed line denotes the upper bound (90% confidence interval) of the ribosome dwelling occupancies. (C) Microarray of seryl-tRNAsSer in LB medium at OD600 = 1.5 (black bars), OD600 = 2.5 (light gray bars) and OD600 = 3.5 (dark gray bars). Data are means ± S.D. For the charging pattern of the whole tRNAome see Supplementary Figure S2C.

