Figure 2.
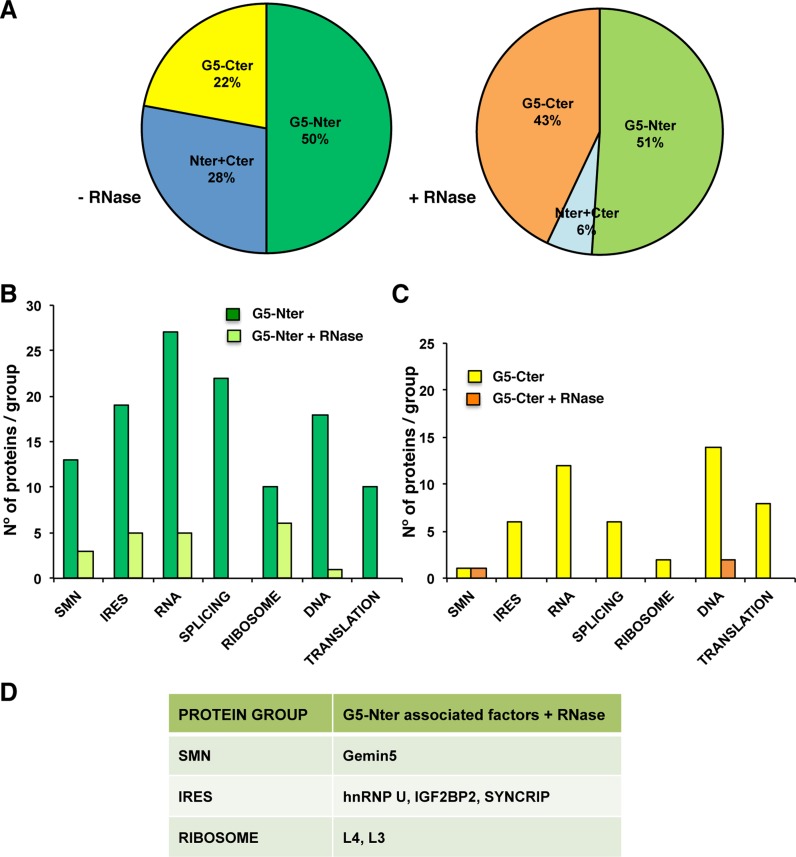
Summary of proteins associated with Gemin5 complexes. (A) Pie chart plot depicting the percentage of proteins preferentially associated to Gemin5 domains, G5-Nter (dark or light green), G5-Cter (yellow or orange) and both regions (dark or light blue), in the absence or presence of RNase treatment, respectively. (B) Proteins associated to the N-terminal domain of Gemin5 identified by LC-MS/MS with more than two peptides in two independent biological replicate assays (about 500 proteins were unequivocally detected in each replica, data are available upon request) were grouped according to their gene function. The histogram depicts the number of proteins in each group versus the mean score (average of the score determined in the proteomic analysis for the proteins within each functional group) of the group associated to the G5-Nter in the absence (dark green bars) or the presence of RNase A treatment during the second TAP step (light green bars). (C) Representation of the proteins associated to the C-terminal domain of Gemin5 identified without (yellow bars) or with (orange bars) RNase A treatment during the second TAP step. (D) Proteins associated to G5-Nter resistant to RNase treatment analyzed in further detail in this work.

