Figure 7.
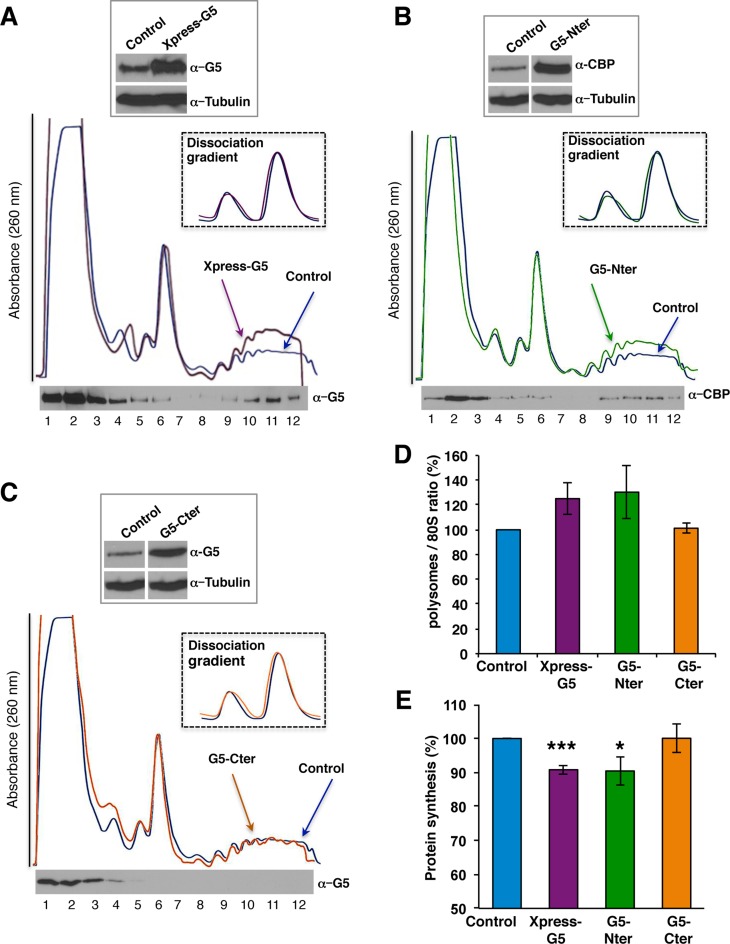
Gemin5 overexpression alters the polysome/80S ratio. (A) Polysome profiles (10–50% sucrose gradient) from cytoplasmic lysates of HEK293 cells expressing Xpress-Gemin5 (purple line) and HEK293 control cells (blue line). (Top) Equal amounts of total protein were separated in SDS-PAGE to determine the expression of Xpress-G5 and Gemin5 by immunoblotting using anti-Gemin5 antibody. Tubulin was used as loading control. (Bottom) The distribution of Xpress-Gemin5 in the fractions of the gradient (15 μl) was immunoblotted using anti-Gemin5 antibody. The inset shows 40S and 60S peaks observed in a dissociation sucrose gradient profile (10–30%) in HEK293 control cells (blue line) compared to Xpress-G5 expression (purple line). Expression of (B) G5-Nter (green line) but not of (C) G5-Cter (orange line) alters the polysome profile, compared to the control cells (blue line). In both cases, the expression of the proteins, and the distribution of G5-Nter and G5-Cter on the gradient fractions (15 μl), was analyzed by WB using anti-CBP or anti-Gemin5 antibodies, respectively. Dissociation sucrose gradients profile showing the 40S and 60S peaks in HEK293 control cells (blue line) compared to G5-Nter (green line) and G5-Cter (orange line) transfected cells. (D) Representation of the mean polysome/80S ratio obtained from three independent polysome profiles determined in cells transfected with Xpress-G5, G5-Nter or G5-Cter compared to control cells. (E) Effect of Xpress-G5, G5-Nter and G5-Cter overexpression on global protein synthesis. The intensity of [35S]-methionine labeled proteins during a 3 h pulse was compared to the control cells; values represent the mean ± SD obtained in three independent assays. Asterisks denote P-values (*P < 0.1; **P < 0.05, ***P < 0.01).

