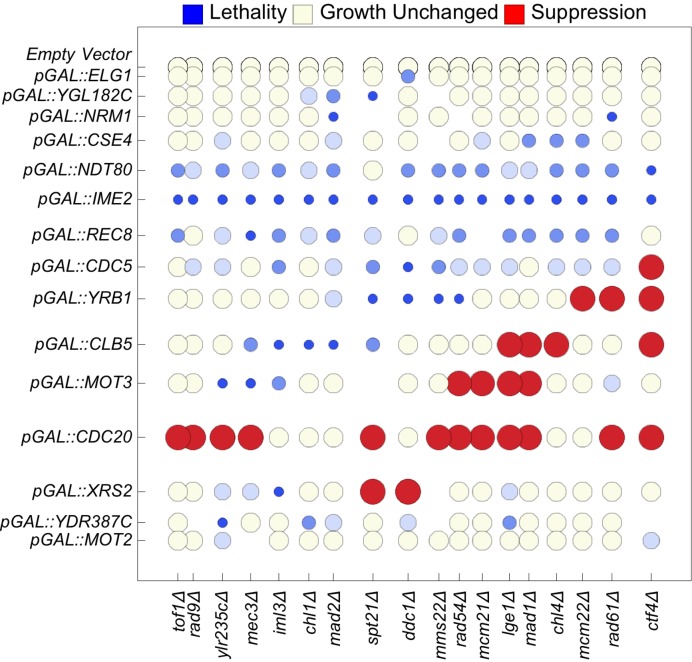
Figure 5.
Seriation of genetic interactions results in a cyclical matrix. We report synthetic dosage lethality (represented as small blue circles), two levels of synthetic dosage sickness (two progressively lighter shades of blue), unchanged growth (yellow), and suppression (large red circles). To seriate the matrix, the rows (columns) of the matrix of genetic interactions are rearranged using integer linear programming to minimize the sum of the n-dimensional Euclidean distances over all pairs of adjacent n-dimensional row vectors (column vectors). The spatial distances of separation between adjacent rows and adjacent columns are proportional to the n-dimensional Euclidean distance between two separated rows or columns, respectively. The resulting order of the genes forms a model of the order of the respective functions of the genes during the cell cycle. The first row (column) is adjacent to the last row (column). Not shown are the rows for pGAL::HHT2, pGAL::CDC4, pGAL::CLN1, and pGAL::HMLα2, which are identical to the row for the empty vector.

