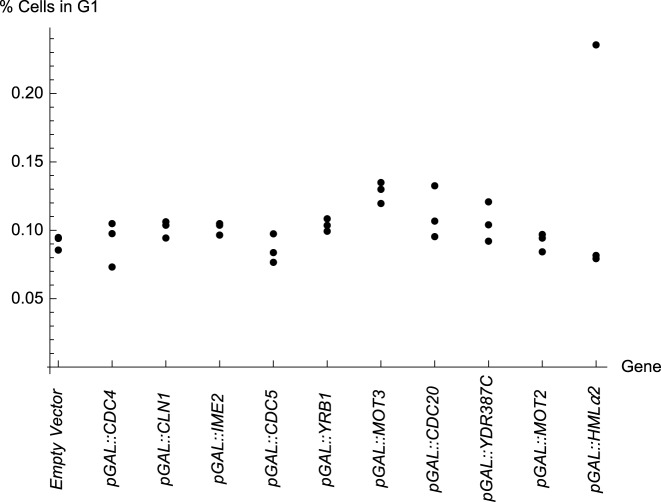
Figure 6.
The percentage of cells in G1 measured by Fluoresence Activated Cell Sorting (FACS). The arrangement peaks with pGAL::MOT3. The order of genes is arranged to match the order of the cycle in Figure 5. Recall from Figure 5 that pGAL::CDC4, pGAL::CLN1 and pGAL::HMLα2 had no genetic interactions and are thus similar to the empty vector. Data for pGAL::NRM1 are excluded because the results were irreprodicible among replicates.

