
Fig. 7.
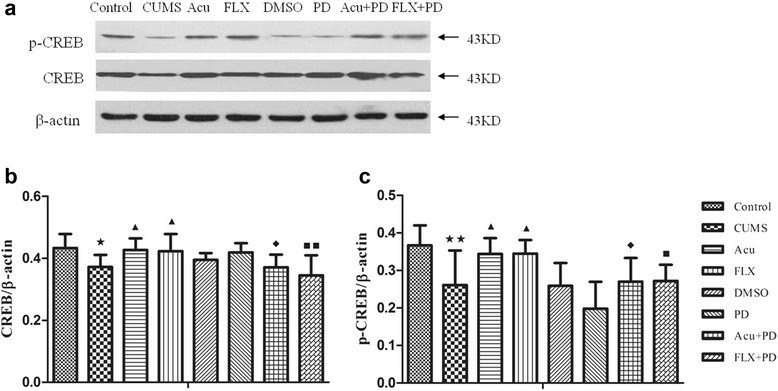
Western blot analysis of CREB and p-CREB. a The representative immunoblot made from hippocampal tissue of rats. b The quantification of CREB/β-actin ratio levels. c The quantification of p-CREB/β-actin ratio levels. ★ P < 0.05, ★★ P < 0.01 vs. control group; ▲ P < 0.05 vs. CUMS group; ◆ P < 0.05 vs. Acu group; ■ P < 0.05, ■■ P < 0.01 vs. FLX group. (mean ± SD, n = 6)