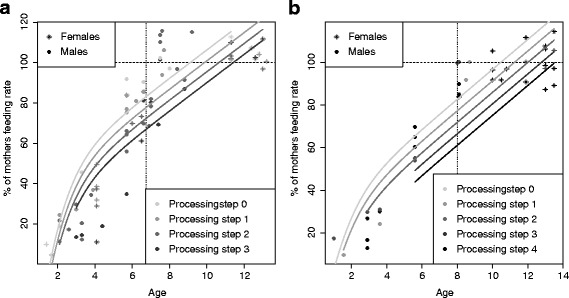
Fig. 2.

Development of feeding rates: Immatures’ feeding rates, expressed as percentage of their mother’s feeding rates, as a function of age and processing complexity of the food items, at Tuanan (a) and Suaq (b). The vertical dotted line shows mean weaning age at each population. The horizontal dashed line marks adult-level feeding rate (100 %)
