Fig. 3.

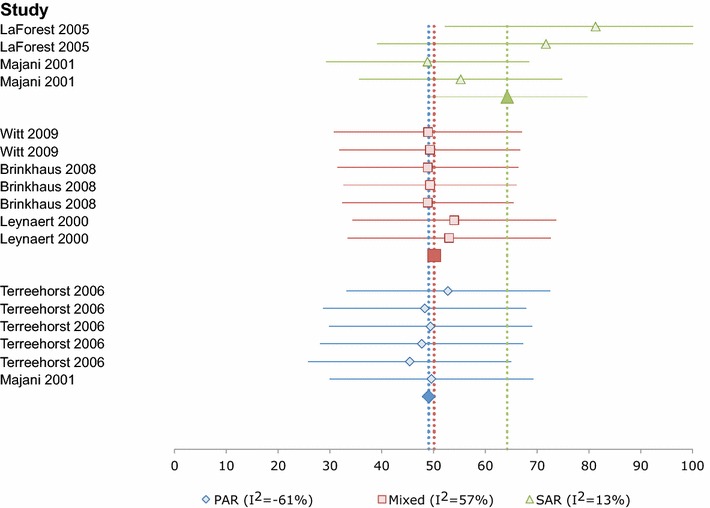
Forest plot of baseline SF-36/SF-12 physical component scores from 17 groups in six studies by phenotype. 95 % confidence intervals for the Mixed and PAR summary measures are hidden by the symbols. Lower scores indicate poorer HRQL

Forest plot of baseline SF-36/SF-12 physical component scores from 17 groups in six studies by phenotype. 95 % confidence intervals for the Mixed and PAR summary measures are hidden by the symbols. Lower scores indicate poorer HRQL