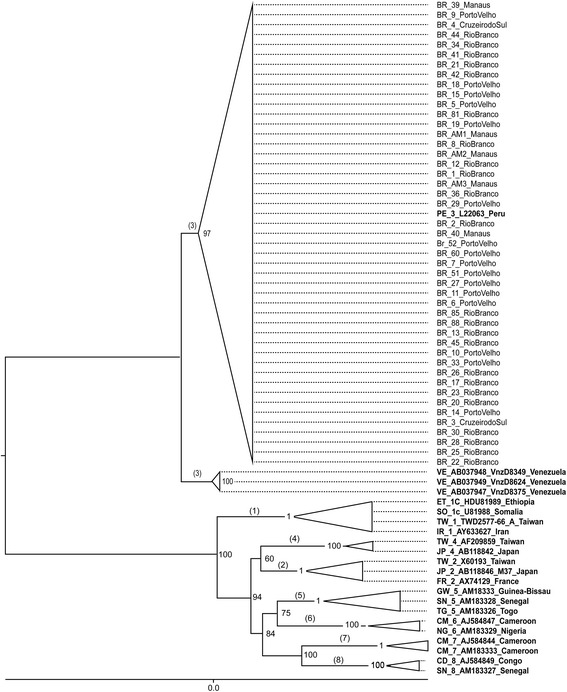
Fig. 1.

Phylogenetic analysis of the sequenced HDV genomes. Each triangle includes the sequences of a same genotype. The Maximum likelihood (ML) tree was constructed using the HKY + G + I model as implemented in PhyML software; values at the nodes of the tree are bootstrap support values obtained using 500 replicates. The tree was constructed using the genomes of 42 isolates generated in this study and the following reference genomes: genotype 1) IR_1_AY633627_Iran, TW_1_TWD2577-66_A_Taiwan, SO_1c_U81988_Somalia, ET_1C_HDU81989_Ethiopia; genotype 2) FR_2_AX74129_France, JP_2_AB118846_M37_Japan, TW_2_X60193_Taiwan; genotype 3) VE_AB037947_VnzD8375_Venezuela, VE_AB037949_VnzD8624_Venezuela, VE_AB037948_VnzD8349_Venezuela, PE_3_L22063_Peru; genotype 4) JP_4_AB118842_Japan, TW_4_AF209859_Taiwan; genotype 5) TG_5_AM183326_Togo, SN_5_AM183328_Senegal, GW_5_AM18333_Guinea-Bissau; genotype 6) NG_6_AM183329_Nigeria, CM_6_AJ584847_Cameroon; genotype 7) CM_7_AM183333_Cameroon, CM_7_AJ584844_Cameroon; genotype 8) SN_8_AM183327_Senegal, CD_8_AJ584849_Congo
