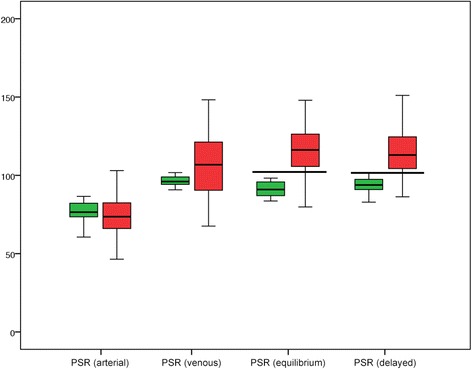
Fig 3.

PSRs in HCC and non-HCC nodules in the different contrast phases. The median PSR for non-HCC (green) remained <100 in all contrast phases, whereas most lesions in the HCC-group (red) exhibited considerable washout, corresponding to a PSR >100. The overlap was smallest in the equilibrium and delayed phases. The horizontal lines indicate cutoff values of 102 and 101.5, which provide the best discrimination between HCC and non-HCC
