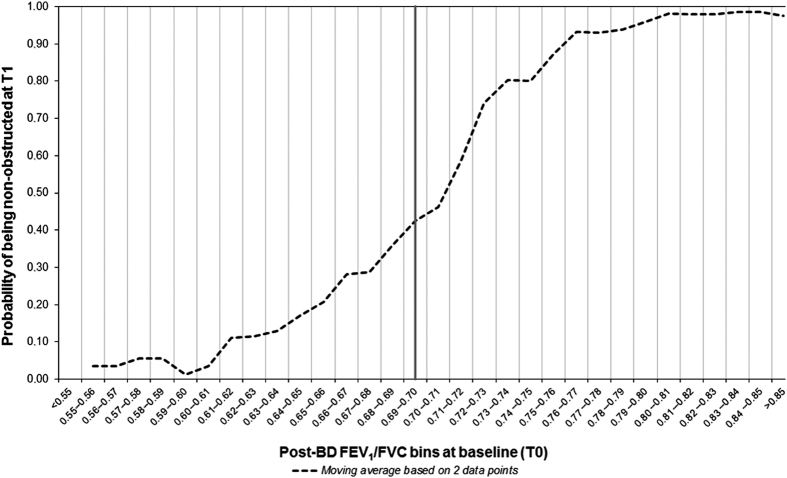
Figure 4.
Probability of being non-obstructed after 1 year (T1) in relation to a subject’s post-BD FEV1/FVC at baseline T0. The graph shows moving averages based on two consecutive data points (i.e., values for the probabilities in the actual FEV1/FVC bin and the next bin) to ‘smooth’ the curve. BD, bronchodilator; FEV1, forced expiratory volume in 1 s; FVC, forced vital capacity.

