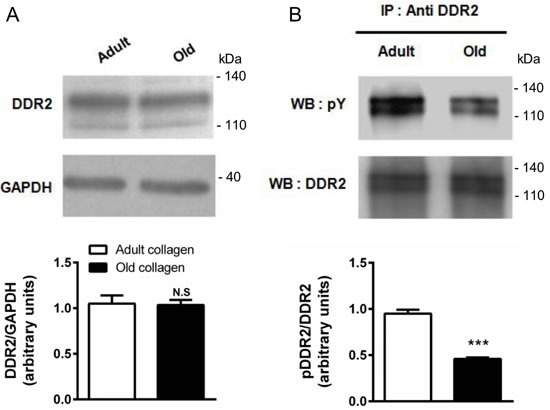
Figure 7. Effect of collagen aging on DDR2 expression and activation.

HT-1080 cells were serum starved during 12 hours, then cultured 6 hours in adult and old type I collagen 3D matrices. A. Western blot analysis was performed using anti-DDR2 specific antibody. The histogram shows the ratio of DDR2 expression relative to the loading control GAPDH. B. Immunoprecipitation was performed using anti-DDR2 specific antibody, and DDR2 activation was measured by western blot using anti-phosphotyrosine specific antibody. The histogram shows the ratio of pDDR2 expression relative to DDR2. Values represent the mean ± S.E.M. of three independent experiments (***p < 0.001, N.S. = not significant).
