
Figure 1. Expression of RANK/RANKL and EMT markers in human EC tissue specimens.
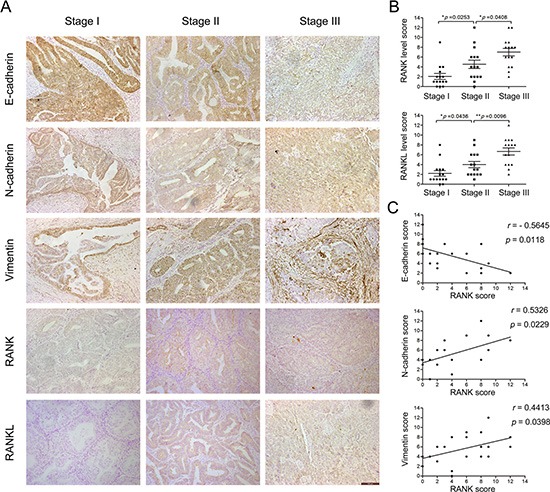
(A) IHC analysis of RANK, RANKL, E-cadherin, N-cadherin and Vimentin in EC (stage I, II, III). Amplification: 200×. Bar = 100 μm. (B) Semi-quantitative analysis of IHC staining determined the levels of RANK and RANKL in each stage of EC. (C) Expression correlations between RANK and E-cadherin, N-cadherin and Vimentin, respectively. Spearman's correlation coefficient test was used to statistical analysis.