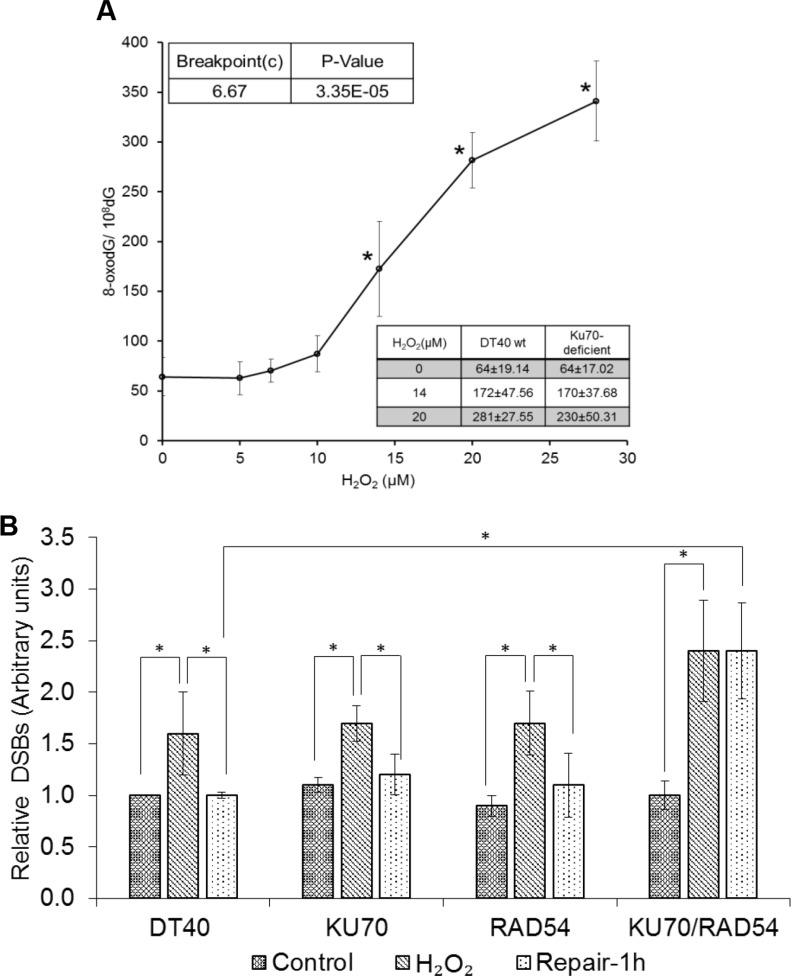
Figure 2. DNA damage induced by low levels of H2O2.
(A) 8-oxodG amounts in DT40 cells exposed to H2O2 for 30 min. The box shows 8-oxodG amounts in isogenic KU70-deficient cells under similar conditions. Data represent mean ± SD. One-way analysis of variance (ANOVA) with Dunnet's test was employed to test for statistically significant differences compared to control. In a second type of statistical analysis, a piece-wise linear model (the hockey stick model) was applied to find the breakpoint value. (B) Generation and repair of DSBs in DT40 and isogenic DSBs repair-deficient cells. To understand the repair kinetics, the H2O2 dose was increased to 50 μM for repair experiments. Cells were exposed to H2O2 for 30 min and processed further for PFGE. Bands representing DSBs were quantified using Quantiscan (Biosoft, Cambridge, UK). Relative DSB levels were obtained by comparing DSBs signals in each sample to the background signals observed for unexposed wild type DT40 cells. Data represent mean (n = 5) ± SD. *p < 0.05 when compared using Student's t test.

