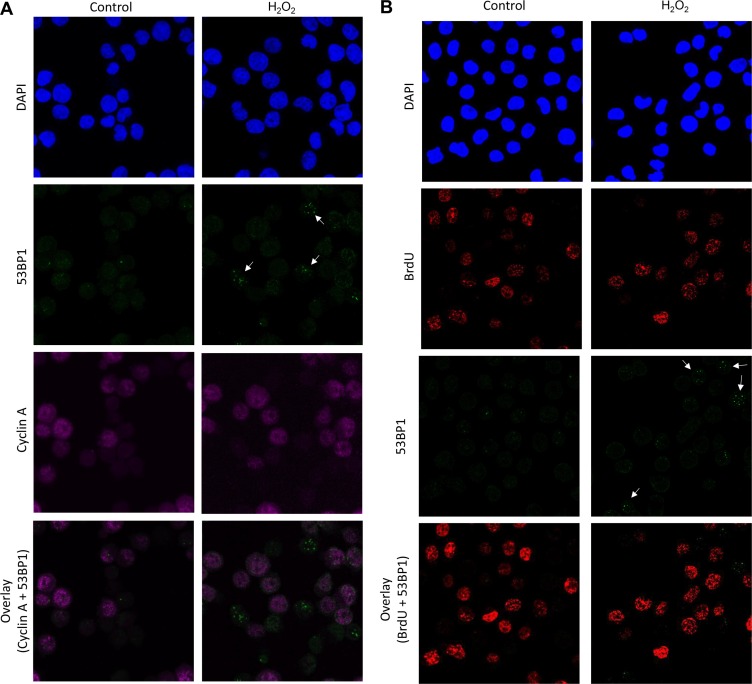
Figure 3. Induction of 53BP1 foci in G1 cells following exposure to H2O2.
(A) TK6 cells were exposed to H2O2 (40 μM) for 30 min and co-immunostained with anti-53BP1 (green) and anti-cyclin A (magenta). (B) TK6 cells were pulse-labelled with BrdU for 15 min and then further incubated with H2O2 (40 μM) for 30 min. Cells were fixed and labelled with anti-53BP1 (green) antibody. BrdU-labelled cells were visualized with Alexa Fluor 555 (red) antibody. Nuclei were counterstained with DAPI (blue). The images were recorded using confocal microscopy and represents maximum intensity projections of z-stacks. 53BP1 foci are marked by white arrows. Magnification, 600×.

