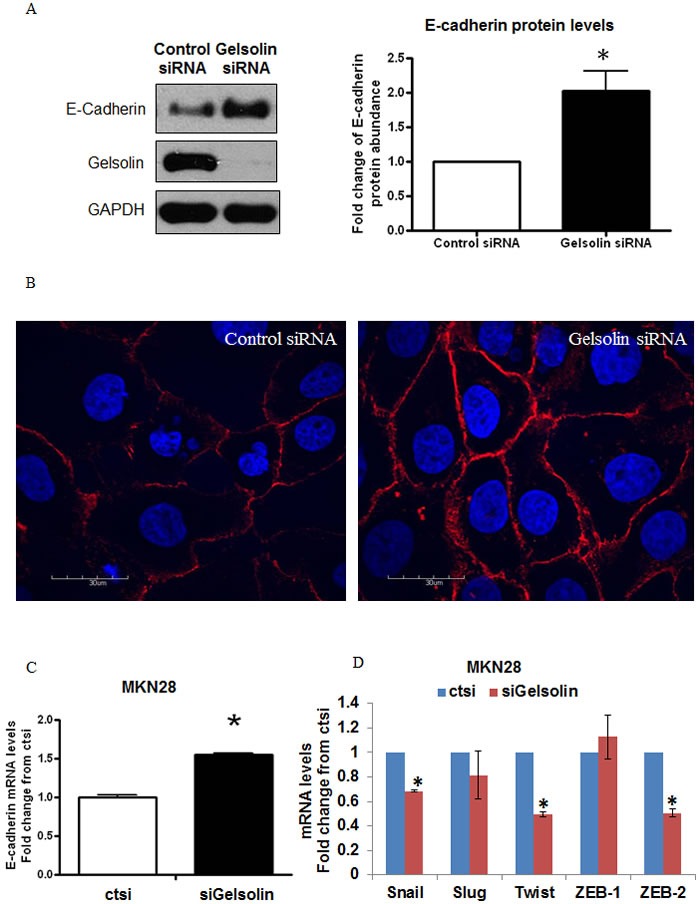
Figure 4. Loss of Gelsolin increases E-Cadherin expression in gastric cancer cells.

A. MKN28 cells were transfected with control scrambled RNA or siGelsolin for 48h. Left: Western blot of E-Cadherin expression levels after transfection. Right: Densitometric analysis of E-Cadherin protein levels normalized to GAPDH protein levels after transfection. Values represent mean ± SD, n = 3, *P < 0.05 vs. control. B. Immunofluorescence staining of E-Cadherin expression levels in MKN28 cells after transfection with control scrambled RNA or siGelsolin for 48h. Images are representatives from three independent experiments.C. E-Cadherin mRNA levels in MKN28 cells after transfection with control scrambled RNA or siGelsolin for 48h, normalised to GAPDH mRNA levels. Values represent mean ± SD, n = 3, *P < 0.05 vs. control. D. Snail, Slug, Twist, ZEB-1 and ZEB-2 mRNA levels in MKN28 cells after transfection with control scrambled RNA or siGelsolin for 48h, normalised to GAPDH mRNA levels. Values represent mean ± SD, n = 3, *P < 0.05 vs. control.
