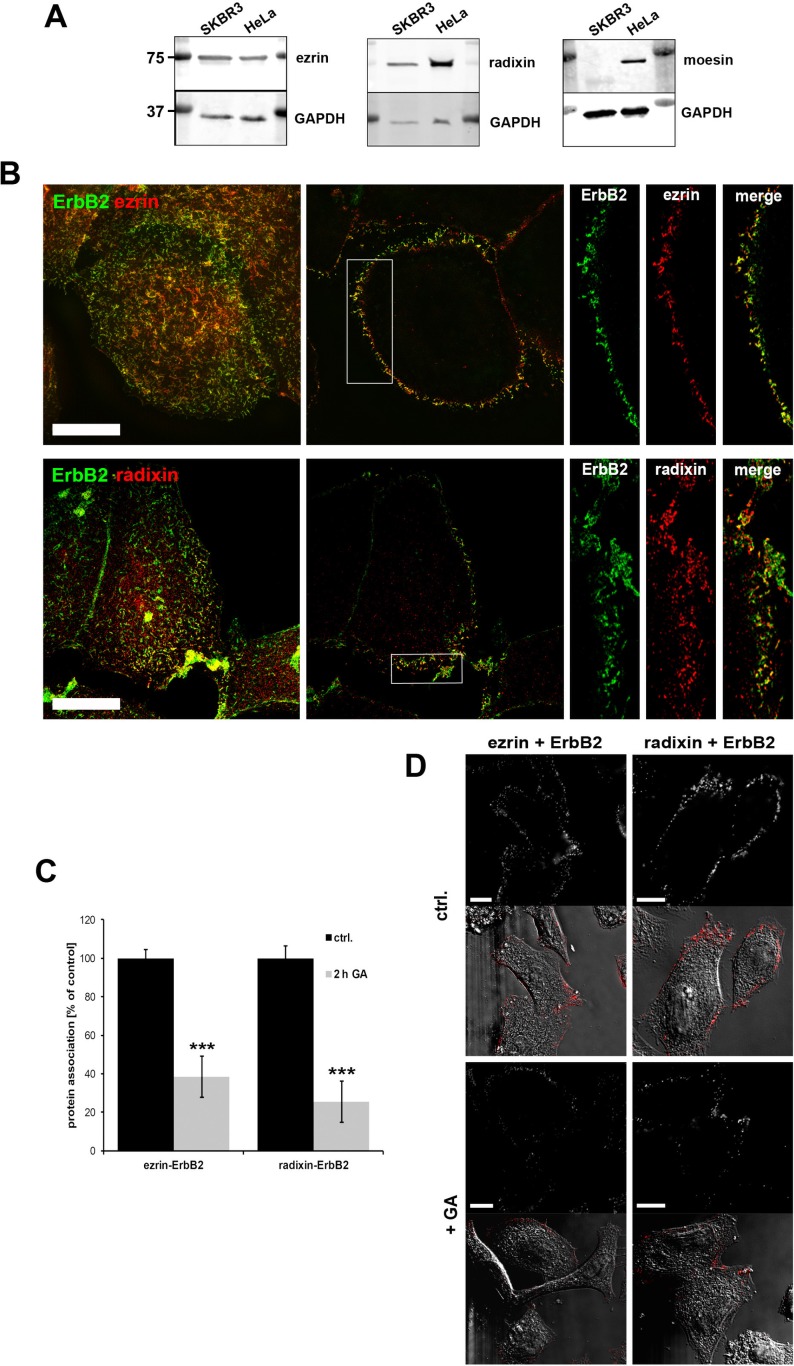
Figure 1. ERM expression and localization in SKBR3 breast cancer cells.
(A) Western blot analysis of ERM levels in SKBR3, HeLa and PC3 cells. SKBR3 breast cancer cells do not express moesin. (B) Colocalization of ezrin/radixin and ErbB2 in SKBR3 cells. 3D-SIM of fixed cells, stained for endogenous ERM and ErbB2, shows a high degree of colocalization between the ezrin/radixin and ErbB2 at the plasma membrane (left panel: max. projection; middle: single plane section; right: single channels of insert). Scale bars: 10 μm. (C) Analysis of protein association in SKBR3 cells by proximity ligation assay (PLA). 2 h treatment with 3 μM GA leads to decreased association of ezrin/ErbB2 and radixin/ErbB2. Data is represented as mean +/− SEM (***P < 0.001). (D) Corresponding single plan section of a representative PLA experiment. Fluorescence and DIC pictures of control cells (upper panel) and cell treated for 2 h with geldanamycin (lower panel) are shown. Scale bars: 10 μm.

