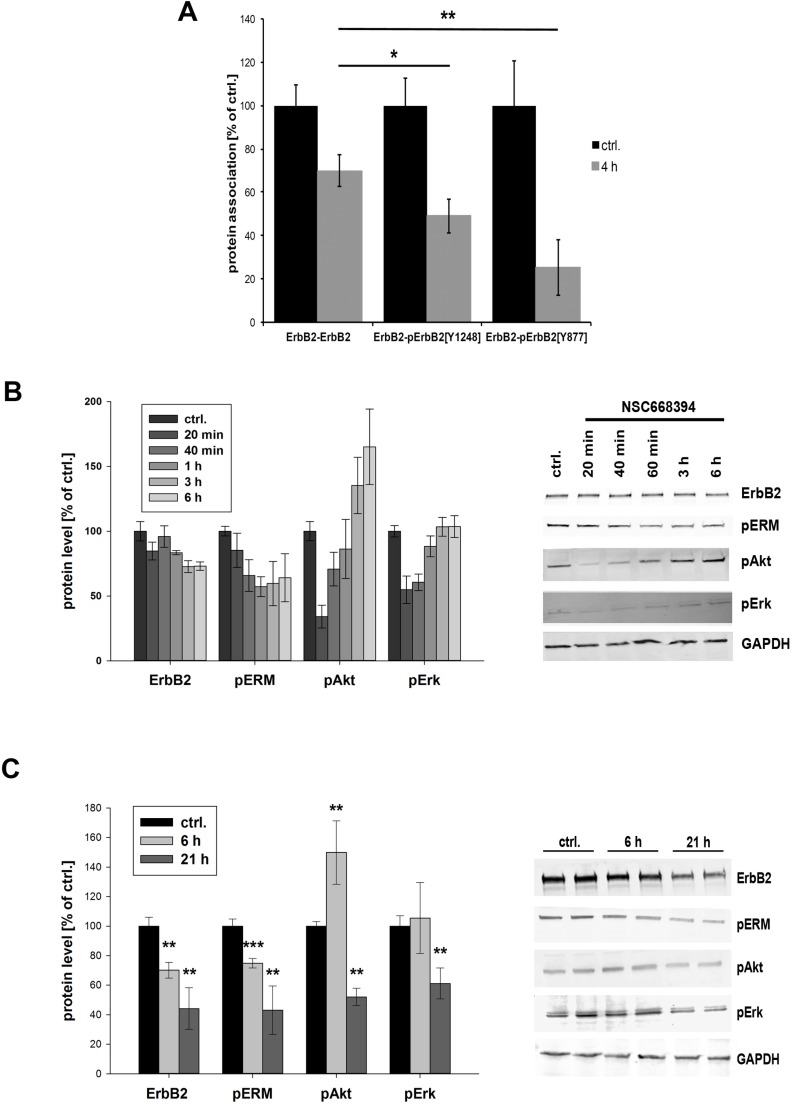
Figure 7. Phosphorylation status and downstream signaling of ErbB2 after ERM inhibition.
(A) Quantification of the phosphorylation of pErbB2Y1248 and pErbBY877 by PLA. Cells have been treated with 30 μm NSC668493 or DMSO for 4 h and PLA experiments were performed on fixed cells. Inhibition of ERM proteins leads to a significantly stronger reduction in the levels of phosphorylated ErbB2Y1248 and ErbB2Y877 compared to total reduction of ErbB2. (B, C) Quantification of Western blot analysis of ErbB2, pERM, pAkt and pErk after treatment with NSC668394. SKBR3 cells were treated with 30 μM NSC668394 or DMSO (control), lysed after different time points and analyzed by SDS-PAGE. All data are shown as mean +/− SEM (*P < 0.05; **P < 0.01; ***P < 0.001).

