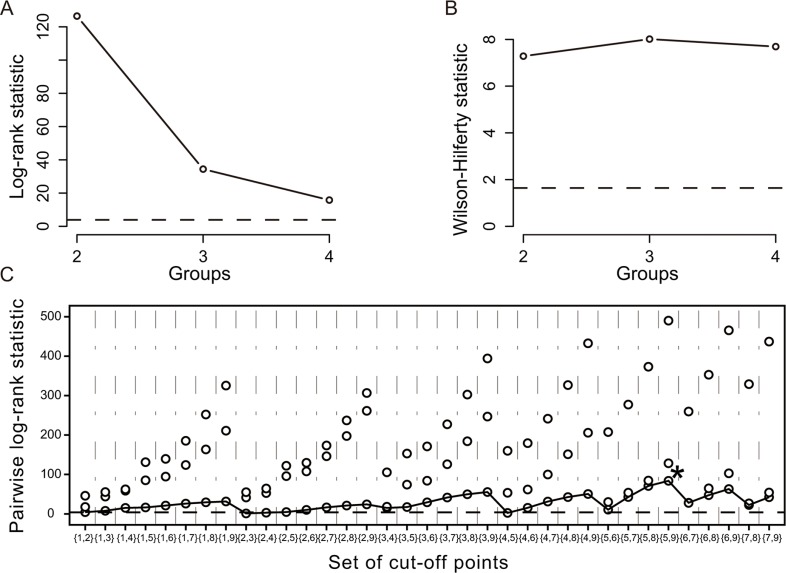
Figure 2. Stratification of patients by the K-adaptive partitioning statistical algorithm in the primary cohort.
(A) Log-rank statistic for the number of groups (K = 2, 3, 4) by cross-validation; (B) Wilson-Hilferty transformation of the log-rank statistics; (C) Pairwise log-rank statistics when the number of groups (K) is 3. (The star symbol indicates the best set of cut-off points).

