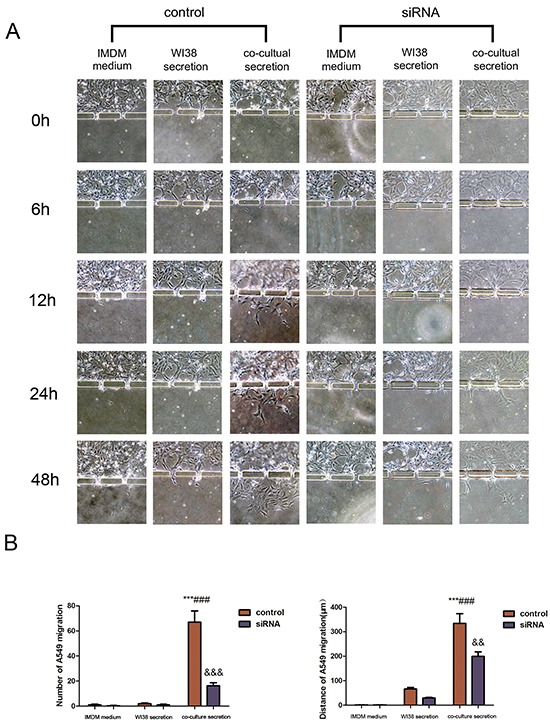
Figure 3. Changes in A549 cell invasion capacity in this 3D microfluidic device.

A. Representative images of the effect of control IMDM and WI38-conditioned and co-culture-conditioned growth media on A549 cell migration at different time points. B. Quantitative data showed the distance of cell migration and the number of migrating and invading cells under the different treatment conditions at 48h. Data are plotted as the mean ± SD of three separate experiments. ***P < 0.001 versus IMDM control; ###P < 0.001 versus WI38 secretion control, &&P < 0.01 and &&&P < 0.001 versus co-culture medium control.
