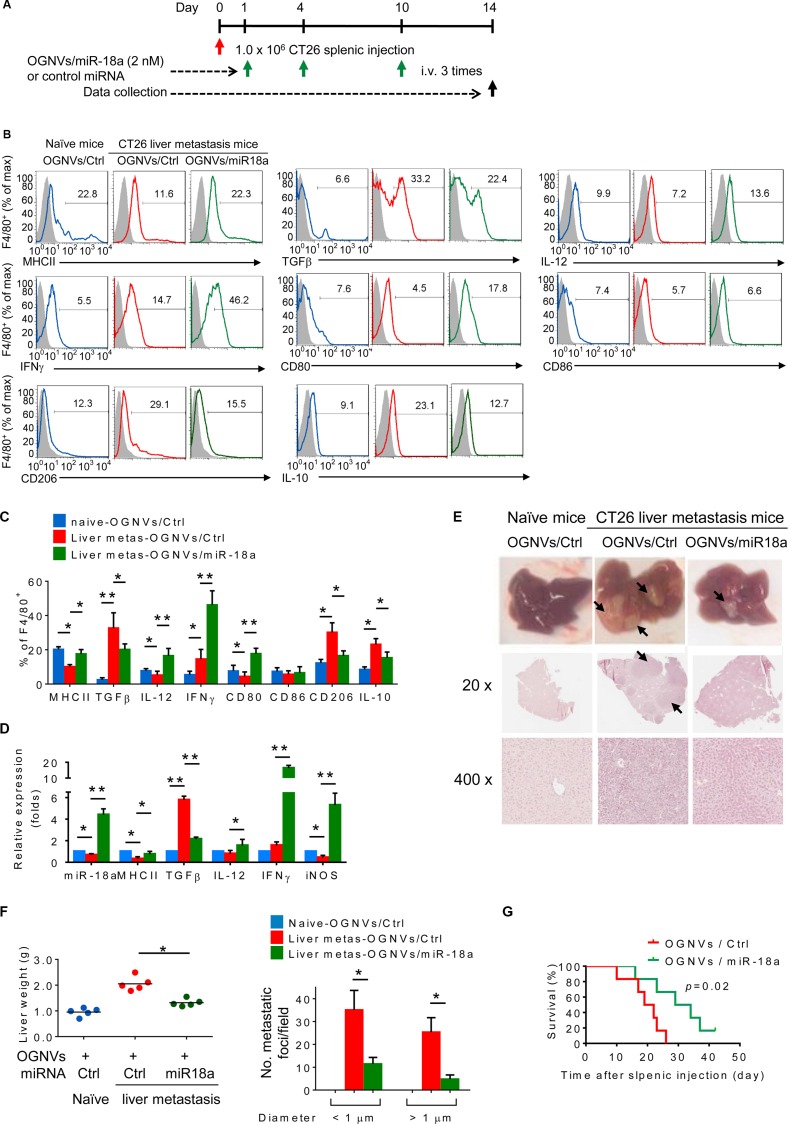
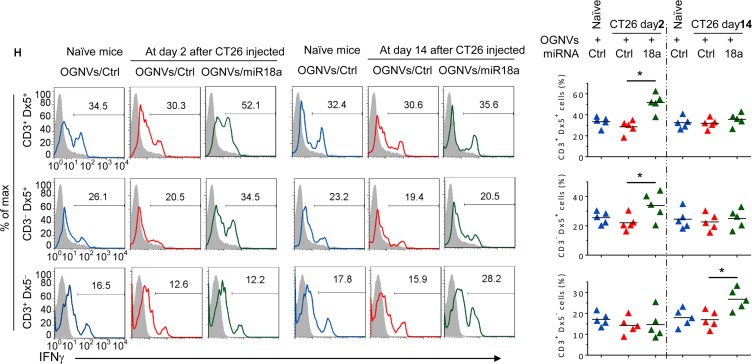
Figure 2. miR-18a encapsulated in OGNVs inhibits liver metastasis of colon cancer and induces Kupffer cell polarization into M1.
(A) Schematic representation of the treatment schedule. All groups of mice were euthanized 14 days after the intra-splenic tumor inoculation, and tumor specimens were obtained for analysis. (B) Frequency of MHCII, TGFβ, IL-12, IFNγ, CD80, CD86, CD206, and IL-10 positive cells in liver F4/80+ cells from naive BALB/c mice, CT26 liver metastasis mice treated with OGNVs packing control miRNA (OGNVs/Ctrl) or OGNVs packing miR-18a (OGNVs/miR-18a) assessed by flow cytometry. (C) The histogram shows the quantification of results at (b). (D) Expression of mature miR-18a, MHCII, TGFβ, IL-12, IFNγ, and iNOS in liver F4/80+ cells was assessed by qPCR. (E) Representative livers (up) and representative hematoxylin and eosin (H & E)-stained sections of livers (middle, 20×; bottom, 400× magnification). (F) Liver weight (left) and liver metastatic nodule number and size (right). (G) Survival of mice after intra-splenic injection of CT26 cells. (H) Frequency of IFNγ+ cells in liver CD3+Dx5+ (NKT) cells, CD3−Dx5+ (NK) cells, and CD3+ Dx5− (T) cells. Right, quantification of results; each symbol represents an individual mouse. *P < 0.05 (two-tailed t-test). Data are representative of three independent experiments (error bars, S.E.M.).


