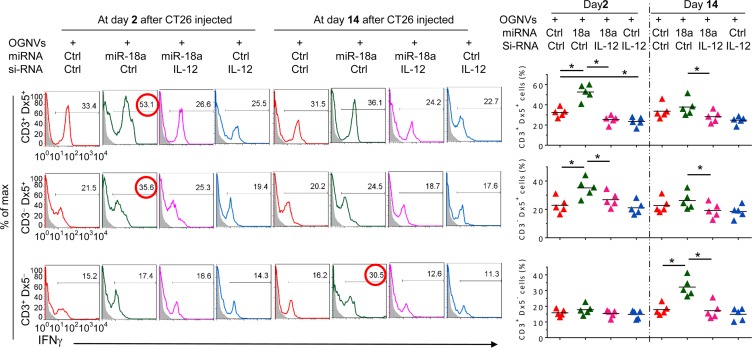
Figure 3. Induction of IFNγ+NK and IFNγ+NKT by OGNVs-miR-18a.
Frequency of IFNγ+ cells in liver CD3+Dx5+ (NKT) cells, CD3−Dx5+ (NK) cells, and CD3+Dx5− (T) cells from CT26 liver metastasis mice treated with OGNVs-Ctrl, OGNVs-miR-18a with/without IL-12 siRNA knockdown assessed by flow cytometry (Left); Right, quantification of FACS analyzed results; each symbol represents an individual mouse.

