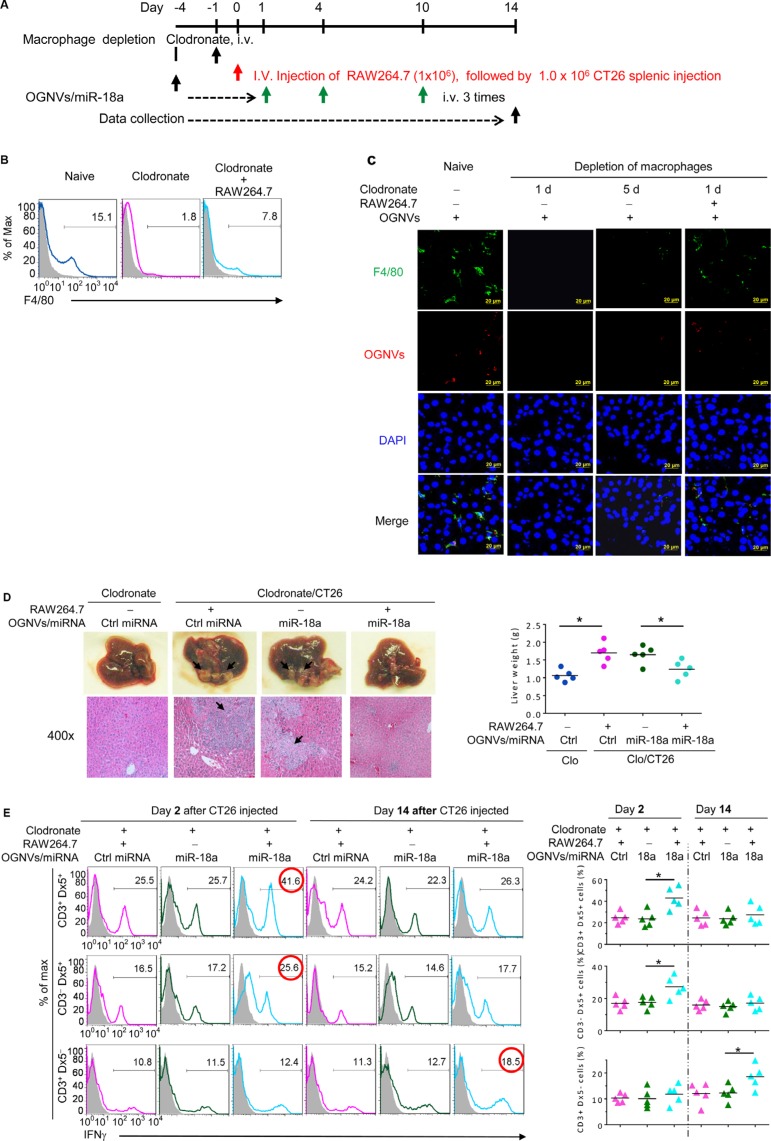
Figure 4. Depletion of macrophages restricted the response of miR-18a against liver metastasis.
(A) Schematic representation of treatment schedule. All groups of mice were euthanized 14 days after the intra-splenic tumor injection, and tumor specimens were obtained for analysis. (B) Frequency of F4/80+ cells in liver leukocytes from clodronate treated (110 mg/kg) mice, with or without RAW264.7 cells assessed by flow cytometry. (C) PKH26-labeled (red) OGNVs located in liver Kupffer cells (F4/80+, green) were visualized with confocal microscopy at 1 d and 5 d after administer of clodronate. Data are representative of three independent experiments. (D) Representative for the treatment effect on liver metastasis (left, upper panel) and hematoxylin and eosin (H & E)-stained liver sections (left bottom panel) from Kupffer cell depleted mice with or without RAW264.7 cells adoptively transferred, Right; Liver weight. (E) Frequency of IFNγ positive cells (left panel) in liver CD3+Dx5+ (NKT) cells, CD3−Dx5+ (NK) cells, and CD3+Dx5− (T) cells from OGNVs/Ctrl miRNA and OGNVs/miR-18a treated mice with/without macrophages pre-depleted. The percentages of positive NK, NKT, and T cells are shown (right panel); each symbol represents an individual mouse. *P < 0.05 (two-tailed t-test). Data are representative of three independent experiments (error bars, S.E.M).

