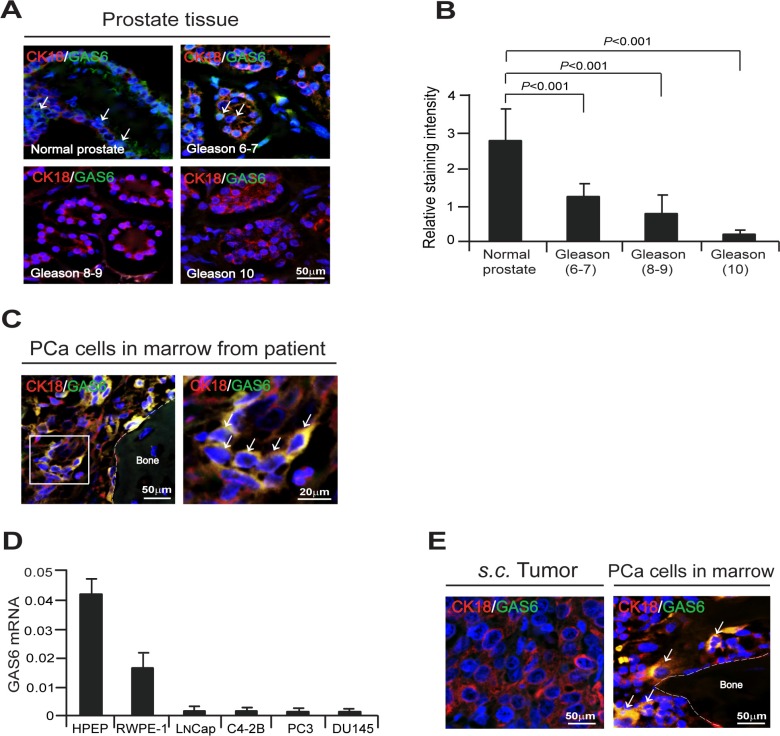
Figure 1. Bone marrow microenvironment activates endogenous GAS6 expression in PCa cells.
(A) GAS6 (green) expression in cytokeratin 18 (CK18, red) expressing cells (white arrows) in human prostate tissue microarrays (TMAs) as detected by immunofluorescence staining. Blue, DAPI nuclear stain. Bar = 50 μm. TMAs are normal prostate tissue (n = 9), Gleason 6–7 prostate cancer tissue (n = 10), Gleason 8 prostate cancer tissue (n = 8), and Gleason 9–10 prostate cancer tissue (n = 18). (B) Quantification of Figure 1A. Data represent as mean ± s.d. (Student's t-test). (C) Left panel: GAS6 (green) expression in CK18 (red) expressing PCa cells in bone marrow of a PCa patient as detected by immunofluorescence staining. Blue, DAPI nuclear stain. Bar = 50 μm. Right panel: GAS6 (green)/CK18 (red) positive cells (white arrows) in the magnification of the white rectangle from left panel. Bar = 20 μm. (D) mRNA levels of GAS6 expression in PCa cells as quantified by real-time PCR. Human prostate epithelial cell lines, HPEP and RWPE-1 were used as a control. (E) GAS6 (green) expression in CK18 (red) expressing PCa cells (white arrows) in s.c. PCa tumors in SCID mice and PCa cells in bone marrow from s.c. PCa tumors in SCID mice as detected by immunofluorescence staining. Blue, DAPI nuclear stain. Bars = 50 μm.

