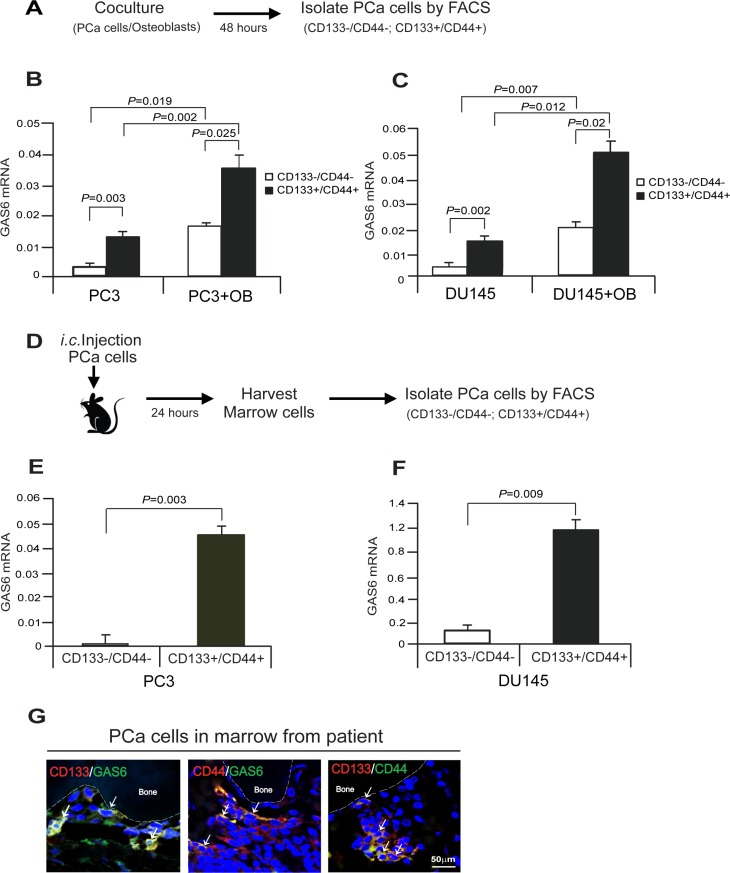
Figure 2. Cancer stem cells express high level of GAS6 in PCa cells in bone marrow microenvironment.
(A) Experimental model of isolation of PCa CSC cells in vitro cocultures of PCa cells with osteoblasts (OB). (B, C) Expression of GAS6 mRNA in CD133–/CD44– or CD133+/CD44+ populations from the cocultures of PCa cells with osteoblasts in vitro as quantified by real-time PCR. Data are representative of mean with s.d. (Student's t-test). (D) Experimental model of isolation of PCa CSC cells in marrow in vivo. (E, F) Expression of GAS6 mRNA in CD133–/CD44– or CD133+/CD44+ populations from DTCs in bone marrow at 24 hours after i.c. injection of PCa cells in SCID mice as quantified by real-time PCR. Data are representative of mean with s.d. (Student's t-test). (G) Immunofluorescence staining of CD133 (red)/GAS6 (green), CD44 (red)/GAS6 (green), or CD133 (red)/CD44 (green) (white arrows) in PCa cells in bone marrow of a PCa patient. Blue, DAPI nuclear stain. Bar = 50 μm.

