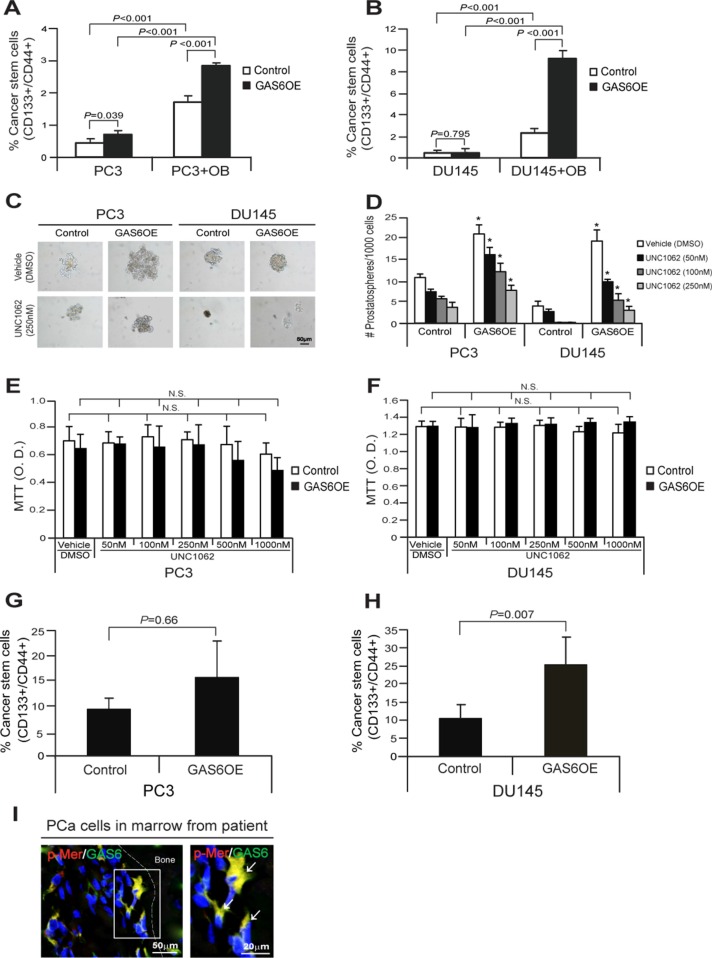
Figure 5. GAS6 overexpression increases CSCs through activation of Mer signaling in PCa cells.
(A, B) Percent of cells expressing the CSC phenotype in coculture of PCaControl or PCaGAS6OE with osteoblasts as quantified by FACS analysis. Data in Figure 5A, 5B are representative of mean with s.d. (Student's t-test). (C) The sphere formation of PCaControl cells or PCaGAS6OE cells in suspended sphere culture conditions following the treatment with a Mer inhibitor, UNC1062. Bar = 50 μm. (D) Quantification of prostatospheres in suspended sphere culture condition. *Denotes p < 0.05 between vehicle vs. a Mer inhibitor, UNC1062 treatments by Student's t-test. (E, F) MTT assays of PCaControl cells or PCaGAS6OE following the treatment with a Mer inhibitor, UNC1062 at 3 day cultures in adherent culture conditions. N.S. denotes no significance (p > 0.05) between vehicle vs. a Mer inhibitor, UNC1062 treatments by Student's t-test. (G, H) % CSC from DTC population in bone marrow at 24 hours after intracardiac injection of PCaControl cells or PCaGAS6OE in SCID mice (n = 5) as quantified by FACS analysis. Data are representative of mean with s.d. (Student's t-test). (I) Left panel: Immunofluorescence staining of p-Mer (red)/GAS6 (green) in PCa cells in bone marrow of a PCa patient. Blue, DAPI nuclearstain. Bar = 50 μm. Right panel: p-Mer (red)/GAS6 (green) positive cells (white arrows) in the magnification of the white rectangle from left panel. Bar = 20 μm.

