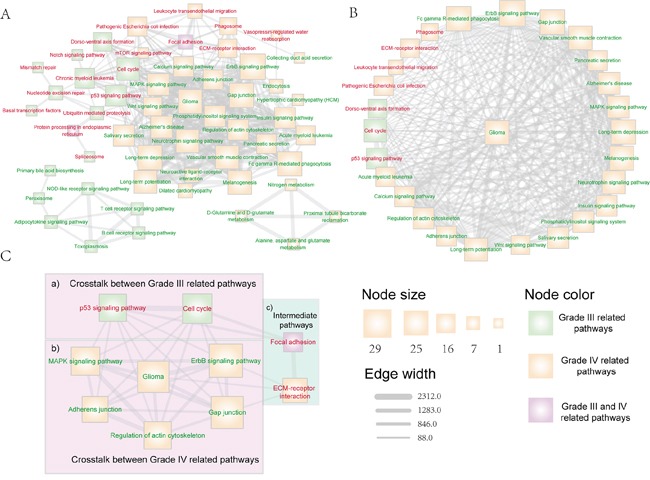
Figure 3. The dysfunctional pathway crosstalk network that associated with glioma malignant progression.

Pathways that enriched by up-regulated (down-regulated) target genes were marked with red (green) node label. Pathways that uniquely related with grade III (IV) glioma were marked with green (yellow) node fill color, while pathways that related with both grade III and grade IV glioma were marked with purple node fill color. Edge-line width is proportional to the dysfunctional crosstalk score of two pathways. Node size is proportional to their degree in the overall dysfunctional pathway crosstalk network. A. The overall dysfunctional pathway crosstalk network that associated with glioma malignant progression. B. Dysfunctional pathways that directly crosstalk with the glioma pathway. C. The core dysfunctional crosstalk module that related with glioma malignant progression, in which two pathway crosstalk routes were included to promote the progression of glioma: (i) direct pathway crosstalk within module between grade III and grade IV related pathways (region a&b); (ii) indirect interactions through pathways not included in module (region c).
